Matplotlib Users:
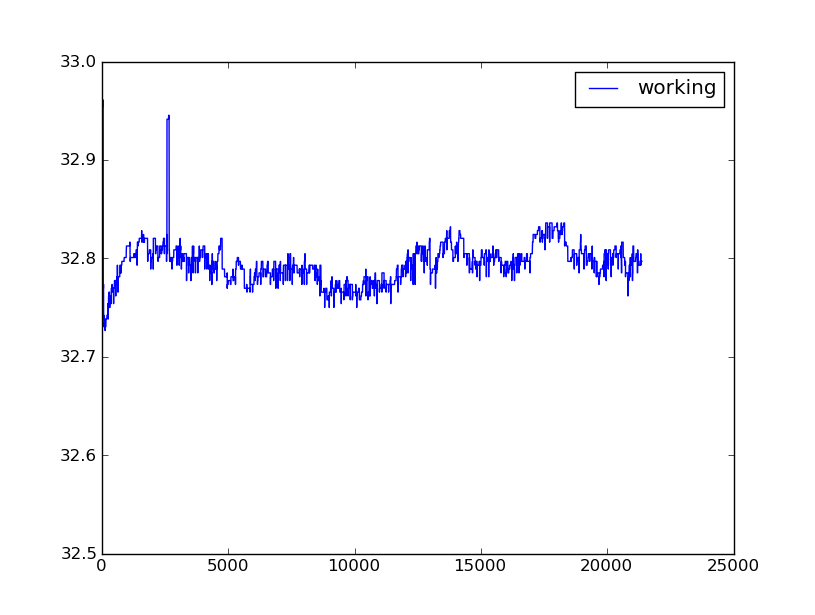
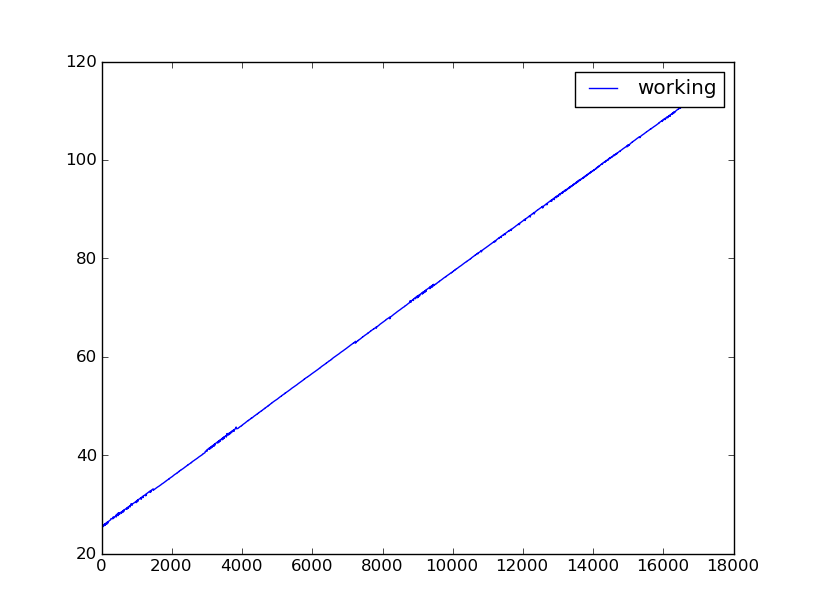
It seems matplotlib plotting has a relatively small memory leak. My
experiments suggest it leaks between 5K and 8K bytes of RAM for ever plot
redraw. For example, in one experiment, plotting the same buffer (so as to not
allocate new memory) every second for a period of about 12 hours resulted in
memory usage (physical RAM) increasing by approximately 223MB, which is about
5.3K per replot. The plotting code is:
class PlotPanel(wx.Panel):
def init(self, parent):
wx.Panel.init(self, parent, wx.ID_ANY,
style=wx.BORDER_THEME|wx.TAB_TRAVERSAL)
self._figure = MplFigure(dpi=None)
self._canvas = MplCanvas(self, -1, self._figure)
self._axes = self._figure.add_subplot(1,1,1)
sizer = wx.BoxSizer(wx.VERTICAL)
sizer.Add(self._canvas, 1, wx.EXPAND|wx.TOP, 5)
self.SetSizer(sizer)
def draw(self, channel, seconds):
self._axes.clear()
self._axes.plot(channel, seconds)
self._canvas.draw()
draw() is called every second with the same channels and seconds
numpy.array buffers.
In my case, this leak, though relatively small, becomes a serious issue since
my software often runs for long periods of time (days) plotting data streamed
from a data acquisition unit.
Any suggestions will help. Am I miss understanding something here? Maybe I
need to call some obscure function to free memory, or something?
My testing environment:
-
Windws XP SP3, Intel Core 2 Duo @ 2.33GHz, 1.96 GB RAM
-
Python 2.6.6 (r266:84297, Aug 24 2010, 18:46:32) [MSC v.1500 32 bit
(Intel)] on win32
-
matplotlib version 1.0.0
-
numpy 1.4.1
-
wxPython version 2.8.11.0
The complete test program follows.
Thanks,
Caleb
from random import random
from datetime import datetime
import os
import time
import win32api
import win32con
import win32process
import wx
import numpy
import matplotlib as mpl
from matplotlib.figure import Figure as MplFigure
from matplotlib.backends.backend_wxagg import FigureCanvasWxAgg as MplCanvas
def get_process_memory_info(process_id):
memory = {}

process = None

try:

    process = win32api.OpenProcess(

        win32con.PROCESS_QUERY_INFORMATION|win32con.PROCESS_VM_READ,

        False, process_id);

    if process is not None:

        return win32process.GetProcessMemoryInfo(process)

finally:

    if process:

        win32api.CloseHandle(process)

return memory
meg = 1024.0 * 1024.0
class PlotPanel(wx.Panel):
def init(self, parent):
wx.Panel.init(self, parent, wx.ID_ANY,
style=wx.BORDER_THEME|wx.TAB_TRAVERSAL)
self._figure = MplFigure(dpi=None)
self._canvas = MplCanvas(self, -1, self._figure)
self._axes = self._figure.add_subplot(1,1,1)
sizer = wx.BoxSizer(wx.VERTICAL)
sizer.Add(self._canvas, 1, wx.EXPAND|wx.TOP, 5)
self.SetSizer(sizer)
def draw(self, channel, seconds):
self._axes.clear()
self._axes.plot(channel, seconds)
self._canvas.draw()
class TestFrame(wx.Frame):
def init(self, parent, id, title):
wx.Frame.init(
self, parent, id, title, wx.DefaultPosition, (600, 400))
self.testDuration = 60 * 60 * 24
self.startTime = 0
self.channel = numpy.sin(numpy.arange(1000) * random())
self.seconds = numpy.arange(len(self.channel))
self.plotPanel = PlotPanel(self)
sizer = wx.BoxSizer(wx.VERTICAL)
sizer.Add(self.plotPanel, 1 ,wx.EXPAND)
self.SetSizer(sizer)
self._timer = wx.Timer(self)
self.Bind(wx.EVT_TIMER, self._onTimer, self._timer)
self._timer.Start(1000)
print "starting memory: ",\
get_process_memory_info(os.getpid())[“WorkingSetSize”]/meg
def _onTimer(self, evt):
if self.startTime == 0:
self.startTime = time.time()
if (time.time() - self.startTime) >= self.testDuration:
self._timer.Stop()
self.plotPanel.draw(self.channel, self.seconds)
t = datetime.now()

memory = get_process_memory_info(os.getpid())
print “time: {0}, working: {1:f}”.format(
t, memory[“WorkingSetSize”]/meg)
class MyApp(wx.App):
def OnInit(self):
frame = TestFrame(None, wx.ID_ANY, “Memory Leak”)
self.SetTopWindow(frame)
frame.Show(True)
return True
if name == ‘main’:
app = MyApp(0)
app.MainLoop()