Hi,
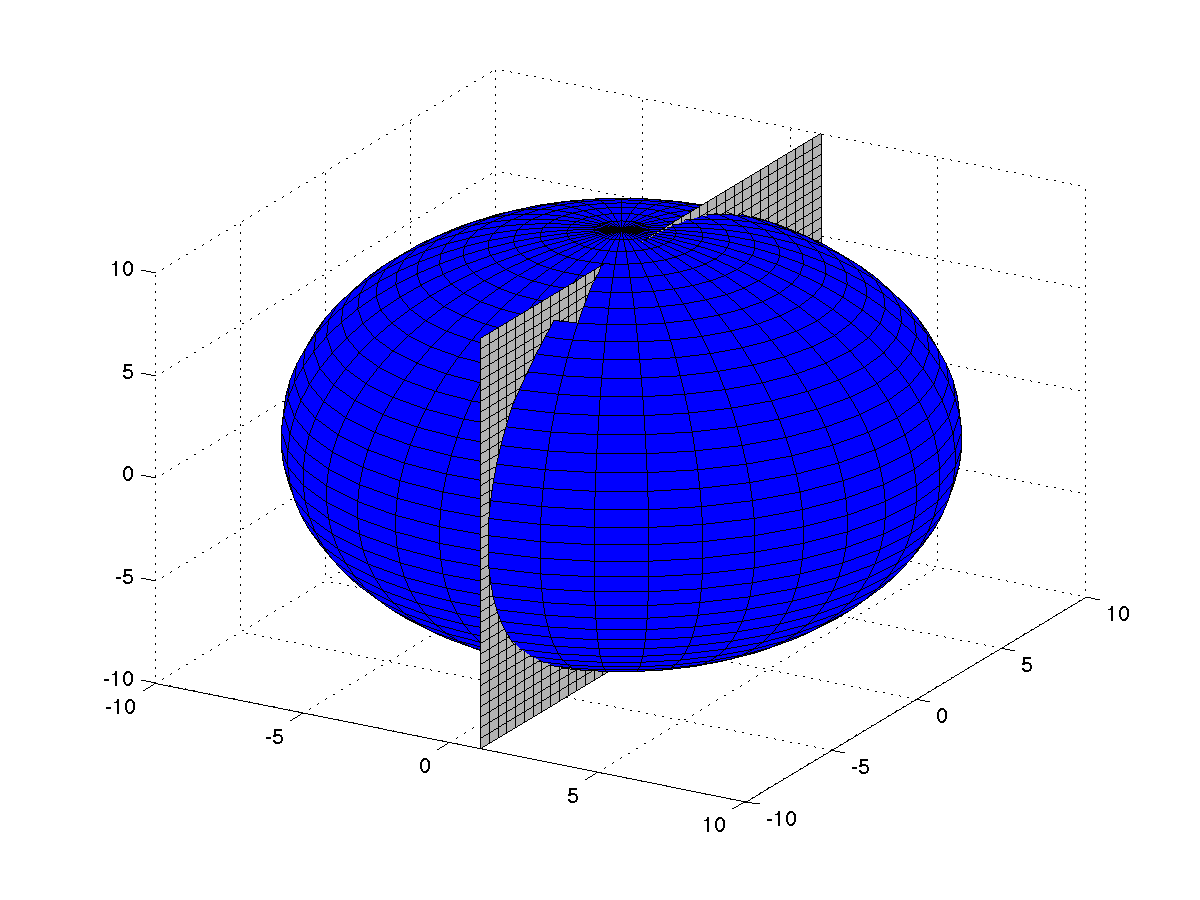
What prevents me from using mplot3d in the classroom is highlighted by the following example.
# surface3d_demo2.py
import matplotlib
from mpl_toolkits.mplot3d import Axes3D
import matplotlib.pyplot as plt
import numpy as np
fig = plt.figure()
ax = Axes3D(fig)
u = np.linspace(0, 2*np.pi, 100)
v = np.linspace(0, np.pi, 100)
x = 10 * np.outer(np.cos(u), np.sin(v))
y = 10 * np.outer(np.sin(u), np.sin(v))
z = 10 * np.outer(np.ones(np.size(u)), np.cos(v))
ax.plot_surface(x, y, z, rstride=4, cstride=4, color='b')
yy = np.linspace(-10, 10, 40)
zz = np.linspace(-10, 10, 40)
[yy, zz] = np.meshgrid(yy, zz)
xx = np.ones(np.shape(yy))
ax.plot_surface(xx, yy, zz, rstride=1, cstride=1, color=".7")
ax.set_xlabel('x-axis')
ax.set_ylabel('y-axis')
plt.show()
This code produces the following image:
http://msemac.redwoods.edu/~darnold/junk/test1.png
Pretty much the same code in Matlab:
u=linspace(0,2*pi,40);
v=linspace(0,pi,40);
[u,v]=meshgrid(u,v);
x=10*cos(u).*sin(v);
y=10*sin(u).*sin(v);
z=10*cos(v);
surf(x,y,z,'FaceColor','b')
yy=linspace(-10,10,40);
zz=yy;
[yy,zz]=meshgrid(yy,zz);
xx=ones(size(yy));
hold on
surf(xx,yy,zz,'FaceColor',[0.7,0.7,0.7])
view(30,30)
print -dpng 'test2.png'
shg
Produces this image:
http://msemac.redwoods.edu/~darnold/junk/test2.png
The inability of mplot3d to determine which image is in front seems to be a problem.
The following page (must be viewed in Firefox) will give some sense of what I need when teaching multivariable calculus.
http://msemac.redwoods.edu/~darnold/math50c/matlab/index.php
David Arnold
College of the Redwoods
http://msemac.redwoods.edu/~darnold/index.php
Davd Arnold
College of the Redwoods
···
On Feb 21, 2010, at 2:02 PM, Ben Axelrod wrote:
I am not a MPL developer, but I am using mplot3d quite heavily right now to support 3D plots for a client of mine. I have found many bugs and lacking features which I require in the mplot3d library and have modified my local copy of the code significantly. I am eagerly awaiting Reinier's return from vacation so that I can work with him to integrate my improvements. For the most part, these fixes simply make the 3D plots behave more like the 2D plots. Here is a tentative list of my changes so far:
* bug fix: placement of title in 3D plots to match 2D plot behavior
* bug fix: allow facecolors and edgecolors to be specified as 'none' in 3D scatter plots to match the 2D scatter plot behavior
* bug fix: allow all keyword arguments to be used in text3D
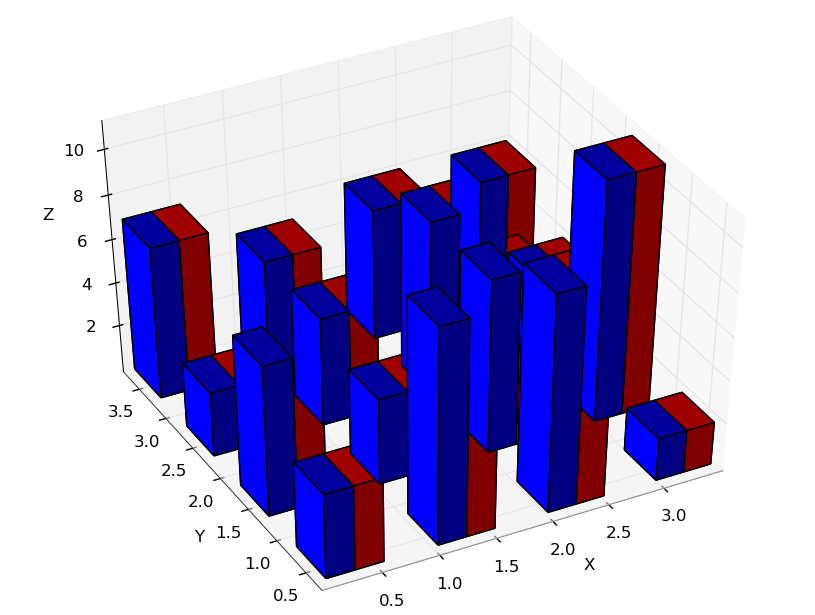
* bug fix: allow an array of colors to be passed into bar3d to specify the colors on a per-bar or per-face basis
* bug fix: allow all keyword arguments to be used in bar3d
* bug fix: allow 3d scatter plots with 3 or 4 points with colors specified
* new feature: new method to disable mouse rotation in 3D plots
* new feature: new Z-order sorting heuristic to eliminate rendering issues for the common case of using bar3d to visualize a 2D histogram
* new feature: new method text2D
* code cleanup: warn when canvas is None which disables mouse callbacks
* code cleanup: fully document more methods in mplot3d
Although I haven't written them yet, I can probably create a couple more example codes:
* example code: demonstrate use of transform() to do rectangle selection in 3D scatter plots
* example code: mplot3d with wx - demonstrate turning off mouse rotations to make pan and zoom toolbar buttons work properly
There are a few other bugs that I would really like fixed, but can't quite figure out right now. Hopefully Reinier will be able to shed some light on these:
* axis label picking for 3D axes
* how to set axis tick label properties for 3D axes
* allow 3d boxes with transparent faces to make "wireframe" boxes
* fix z-order sorting across multiple calls to bar3d()
I should note that because of my client, I have a vested interest in seeing mplot3d (with the above bug fixes) make it into a stable release of MPL. But at the same time, I don't have a lot of spare time to spend on MPL development.
Thanks,
-Ben
________________________________________
From: John Hunter [[email protected]...]
Sent: Sunday, February 21, 2010 12:19 PM
To: Jakub Nowacki
Cc: [email protected]
Subject: Re: [Matplotlib-users] mplot3d stays?
On Sun, Feb 21, 2010 at 8:20 AM, Jakub Nowacki > <[email protected]...> wrote:
Hi,
I have quite general question. Since mplot3d now back in matplotlib, the question is: is it going to stay there? Or is it some test release? I was just wondering cause sometimes I use 3d plotting and use Mayavi2 for that but in many cases it's like killing the spider with a shotgun, not mentioning that installation process can be quite tricky.
Thanks for answer in advance/
Like anything in open source, it stays as long as someone supports it.
The original implementation in matplotlib.axes3d was not supported by
the original authors and none of the core developers had the bandwidth
to support it, so we pulled it when a significant transformations
refactoring broke the existing 3D support and noone had the resources
to fix it. It languished for a while to Reinier picked up the torch
with help from others and reintegrated it into mpl. To date he has
been supporting it but is mostly acting alone (bus factor 1) . So we
plan to continue support for mpl but we need developers to do it, so
don't be shy about jumping into the code base and seeing if you can
make incremental enhancements when you need them.
On the plus side, the core of mpl is in pretty good shape, so I don't
anticipate the need for a significant refactoring of the internals of
the kind Michael did a couple of years ago which broke mplot3d the
first time.
JDH
------------------------------------------------------------------------------
Download Intel® Parallel Studio Eval
Try the new software tools for yourself. Speed compiling, find bugs
proactively, and fine-tune applications for parallel performance.
See why Intel Parallel Studio got high marks during beta.
http://p.sf.net/sfu/intel-sw-dev
_______________________________________________
Matplotlib-users mailing list
[email protected]
matplotlib-users List Signup and Options