mplot3d stays?

Dear all,

I don't know if creating full blown 3d library makes much sense. I think Reinier is right here that the current mplot3d creates quite satisfactory outcome with matplotlib look-and-feel we all like. In general, there are 3d libraries/packages out there (VTK, Mayavi2 etc.), which do most of the stuff one would need. The problem is many times using is not that trivial. Also, the installation process is usually much more complex, eg. setting up mayavi2 on snow leopard took me several days.

I asked the question in the first place because in many cases I need rather simple 3d plotting tool, without al the massive rendering capabilities etc. Since I use matplotlib anyway, it would be nice to use the same tool and not be forced to install and learn something new just to plot not very complicated surface. Hence, I think the main goal here should be to have a relatively simple but usable plotting tool with matplotlib look-an-feel.

BTW I didn't know that my simple question would generate such a discussion. :slight_smile:

Best wishes,

Jakub

I also agree with Reinier. I want my 3d plots to look as close as possible to my 2d plots. Because mplot3d uses so much of the same matplotlib core, this is trivial. As Friedrich mentioned, the mplot3d code is actually pretty small. To me, that is a great feature. I found the mplot3d code very accessible.

I do agree that there is still much work to be done in mplot3d. But I think starting from scratch is a waste of time.

FYI, I looked into using mayavi2 before settling on mplot3d. Mayavi can create some stunning graphics, but I found that it is very restrictive in its plotting options. Take for example the 3d scatter plot. They combined the size and color parameter. Getting around this strange restriction took me quite some time. (Installation for me was also a pain due to VTK).

-Ben

···

-----Original Message-----
From: Jakub Nowacki [mailto:j.s.nowacki@…982…]
Sent: Friday, February 26, 2010 12:01 PM
To: matplotlib-users
Subject: Re: [Matplotlib-users] mplot3d stays?

Dear all,

I don't know if creating full blown 3d library makes much sense. I think Reinier is right here that the current mplot3d creates quite satisfactory outcome with matplotlib look-and-feel we all like. In general, there are 3d libraries/packages out there (VTK, Mayavi2 etc.), which do most of the stuff one would need. The problem is many times using is not that trivial. Also, the installation process is usually much more complex, eg. setting up mayavi2 on snow leopard took me several days.

I asked the question in the first place because in many cases I need rather simple 3d plotting tool, without al the massive rendering capabilities etc. Since I use matplotlib anyway, it would be nice to use the same tool and not be forced to install and learn something new just to plot not very complicated surface. Hence, I think the main goal here should be to have a relatively simple but usable plotting tool with matplotlib look-an-feel.

BTW I didn't know that my simple question would generate such a discussion. :slight_smile:

Best wishes,

Jakub
------------------------------------------------------------------------------
Download Intel® Parallel Studio Eval Try the new software tools for yourself. Speed compiling, find bugs proactively, and fine-tune applications for parallel performance.
See why Intel Parallel Studio got high marks during beta.
http://p.sf.net/sfu/intel-sw-dev
_______________________________________________
Matplotlib-users mailing list
Matplotlib-users@lists.sourceforge.net
https://lists.sourceforge.net/lists/listinfo/matplotlib-users

I also agree with Reinier. I want my 3d plots to look as close as possible to my 2d plots. Because mplot3d uses so much of the same matplotlib core, this is trivial. As Friedrich mentioned, the mplot3d code is actually pretty small. To me, that is a great feature. I found the mplot3d code very accessible.

Yes, I agree that it's really readable. But I didn't understand the
sorting algorithm in plot_surface().

I do agree that there is still much work to be done in mplot3d. But I think starting from scratch is a waste of time.

Well, I see ... When I write code "from scratch" as I often do, I mean
to open a new file and to copy old code only if it useful or
necessary. So I don't want to break the old code. I in fact think
the current code is doing good work. But to my perception, it
nevetheless needs some additional concepts like the global "surface
space" and another sorting algorithm.

FYI, I looked into using mayavi2 before settling on mplot3d. Mayavi can create some stunning graphics, but I found that it is very restrictive in its plotting options. Take for example the 3d scatter plot. They combined the size and color parameter. Getting around this strange restriction took me quite some time. (Installation for me was also a pain due to VTK).

That's important information, at least for me. I was so impressed by
mayavi, that I was near to be stopped from all enthusiasm for mplot3d.
But I see, there would be some use. The arguments you gave are
already quite strong. I think the possibility to plot 2d things in 3d
context like a stack of curves using the matplotlib style seems to be
quite a good thing, isn't it?

I would like to tell some "fresh look" onto the problem just coming
into my mind. What about turning matplotlib itself into the 3D
rendering engine? This would maybe be like a fork. But it would
leave all matplotlib commands intact, putting the layer like this:

matplotlib

···

------------------
3D rendering engine
------------------
backend

Instead of:

3D rendering engine
--------------------
matplotlib
--------------------
backend.

I mean, the matplotlib would create some kind of plotting commands,
either 2d or 3d. The 3d ones would be translated into 2d camera space
by the intersecting layer. 2d ones would be promoted to the 3d camera
space before being projected into the 2d camera space. This is a raw
idea, I'm shure, so please don't kill me for it. When it turns out to
be without substance, I would not be offended.

How feasible would this be?

Friedrich

P.S.: But it would maybe simplify the sorting much. The 3D engine
stores the projected polygons with z information (z as the depth from
the camera). When another polygon arrives, it will be cut /after
projection/ into pieces based on the polygons in front of it, and be
drawn upon all polygons behind. The weel again?

P.P.S.: I'm very un-self-confident about this ideas. But I read, in
OSS one should also publish half-baken ideas, even when they do not
compile ...

http://www.friedrichromstedt.org/python/pyclip/a01.Zerteilung.pdf
(It's unfortunately in german, but the graphics are self-explaining)
A school mate working together with me on the project has worked that out.

H = number of corners of the front triangle lying inside of the back triangle

V = number of corners of the back triangle lying inside of the front triangle

S = number of the collinear edges of the two triangles

Z = number of intersection points of the two tringles' edges, minus
the number of those occuring because of collinear edges.

Red: front triangle
Black: back triangle
Green: subdivision lines in the back triangle.

I will check my implementation in C++ today. I will maybe need some
advice in making a Python module out of it.

Friedrich

Interesting, but I think subdividing triangles like this is unnecessary. For most cases, when one triangle completely covers the other, all that is required it to Z order the triangles. This is what mplot3d does already. The only case we have yet to handle is when one triangle "pierces" the other. As seen in the attached image. Triangle B is mostly behind triangle A, except for a small piece labeled C. All we would have to do is determine the line of intersection, then create a new triangle C. Then we just draw B first, then A, then C.

I think the hardest part is probably doing this for general polygons and handling the edges properly. But that should not be super hard.

-Ben

triangles.png

···

________________________________________
From: Friedrich Romstedt [friedrichromstedt@...287...]
Sent: Saturday, February 27, 2010 11:28 AM
To: matplotlib-users
Subject: Re: [Matplotlib-users] mplot3d stays?

http://www.friedrichromstedt.org/python/pyclip/a01.Zerteilung.pdf
(It's unfortunately in german, but the graphics are self-explaining)
A school mate working together with me on the project has worked that out.

H = number of corners of the front triangle lying inside of the back triangle

V = number of corners of the back triangle lying inside of the front triangle

S = number of the collinear edges of the two triangles

Z = number of intersection points of the two tringles' edges, minus
the number of those occuring because of collinear edges.

Red: front triangle
Black: back triangle
Green: subdivision lines in the back triangle.

I will check my implementation in C++ today. I will maybe need some
advice in making a Python module out of it.

Friedrich

------------------------------------------------------------------------------
Download Intel® Parallel Studio Eval
Try the new software tools for yourself. Speed compiling, find bugs
proactively, and fine-tune applications for parallel performance.
See why Intel Parallel Studio got high marks during beta.
http://p.sf.net/sfu/intel-sw-dev
_______________________________________________
Matplotlib-users mailing list
Matplotlib-users@lists.sourceforge.net
https://lists.sourceforge.net/lists/listinfo/matplotlib-users

Things become more and more complicated with time. I come up with
four things to consider:

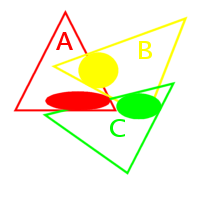
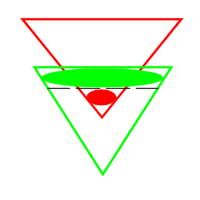
First the ring I already mentioned is visualised in attachment
Ring.png. A > C > B > A, no z sorting possible, because no linear
order anymore.

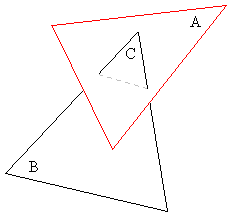
Second, the intersecting line may not always separate a tringle in
front as in your example, see "Fourangle".png. Though either the
front or the back part of the intersected tringle is always a
triangle. Furthemore, I suggest to cut both tringles along the
intersection line. This makes things easier to implement, I'm quite
convinced.

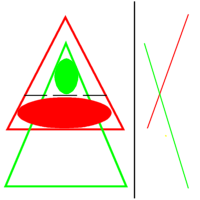
Third, z sorting. How does the current algorithm I didn't understand
work? One may consider pict z-sorting.png. For a simple-minded
algorithm comparing the center of mass, the triangle in front seems to
be at higher z.

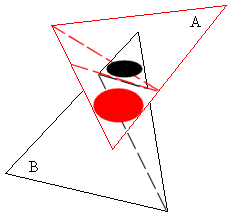
Fourth, detection of intersection. With the algorithm I proposed, I
assume non-intersecting triangles. The problem is how to detect
intersection at all. One might think that it's sufficient to check in
the corners for inconsistencies with non-intersection. But
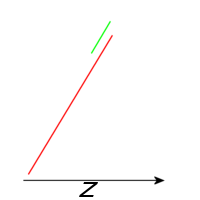
unfortunataly, it isn't like that. In pict Tricking.png is an
example. An algorithm checking the corners will find out that [red]
is in front of [green], and nothing more, and hence cannot conclude
towards intersection. I have no straightforward idea?

One idea more: Not leaving B in your example triangles.png intact,
but creating two new planar convex 4-polygons, filling those with
triangles is very easy and straightforward. Thus it works out for A
and B as pointed out in triangles2.png.

Thus 1. detect intersecting triangles and cut them into pieces, second
apply z sorting or equivalents?

I had implemented z sorting for pairs of triangles already, and would
like to compare with the mplot3d algorithmic idea. Using this, one
could simply let a sort algorithm of any kind do the job. Apart from
that results may look strange when there are rings :slight_smile:

2010/2/28 Ben Axelrod <BAxelrod@...2066...>:

Interesting, but I think subdividing triangles like this is unnecessary. For most cases, when one triangle completely covers the other, all that is required it to Z order the triangles. This is what mplot3d does already. The only case we have yet to handle is when one triangle "pierces" the other. As seen in the attached image. Triangle B is mostly behind triangle A, except for a small piece labeled C. All we would have to do is determine the line of intersection, then create a new triangle C. Then we just draw B first, then A, then C.

I think the hardest part is probably doing this for general polygons and handling the edges properly. But that should not be super hard.

Hmm. First I thought: One should create pathes of lines and patches
of surfaces. The lines do not need to be z ordered at all, they just
have to be z ordered against the surfaces. But that's not sufficient,
because lines /on/ surface may be drawn before the surface or not, at
random, spoiling the thing. Maybe have for each triangle outline
attributes? I guess that's what you had in mind from the beginning.

Friedrich

Fourangle.png

Ring.png

triangles2.png

Tricking.png

z-sorting.png