Hi,
I have asked this question on Stackoverflow alredy, but got no answer. Thread
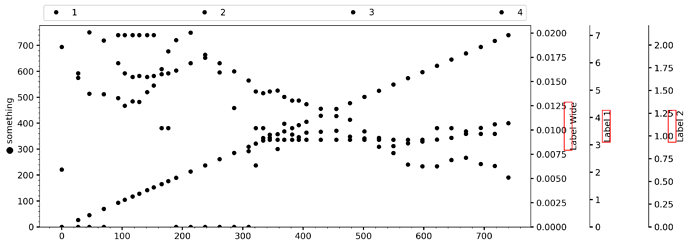
I want to read out the position of an Axis-label to append a second text on the same line (colored) like this:
labelpos = ax.yaxis.label.get_window_extent()
box = labelpos.transformed(ax.transAxes.inverted())
but. the result is this:
And the same with the ticklabels:
extents1, extents2 = ax.yaxis.get_ticklabel_extents(renderer = fig.canvas.get_renderer())
box = extents2.transformed(ax.transAxes.inverted())
After some research I have found my problem could lay way deeper, for the matplotlib.artist.Artist.get_window_extent it says from here:
Be careful when using this function, the results will not update if
the artist window extent of the artist changes.
Soo… could it be that the labels getting moved by the artist and it is not possible to read out the current position?
get_window_extent gives you the absolute size and location of the artists in “screen space” (which is normally pixels), however many of the artistst are placed using non-absolute units (like axes fraction, figure fraction, displacements from other artists. If you are using tight_layout or constrained_layout we may adjust the locations of things at draw time (bbox_inches='tight' may also be problematic here, but I don’t know for sure off the top of my head). Additionally, if the dpi or size of the figure changes the absolute size/location of all of the artists are going to change.
From the code here it is hard to guess too many details, but explicitly calling fig.canvsa.draw() may solve your problem (by forcing a rendering to make the extents less stale) an ensuring that you are saving at the same size/dpi you are rendering at.
If you want to add a second text attached to the first,
https://matplotlib.org/3.2.1/tutorials/text/annotations.html#using-complex-coordinates-with-annotations may be a better approach (as it has mpl do the adjustments to the second text at just the right time).
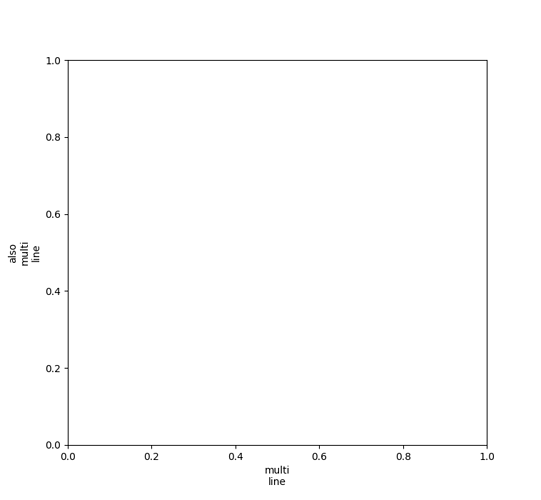
If you don’t need the second line to be styled differently than the first you can also do
fig, ax = plt.subplots()
ax.set_ylabel('also\nmulti\nline')
ax.set_xlabel('multi\nline')
1 Like
Thank you!
I already did a canvas.draw, and had the dpi settings the same (100). The Multi line is sadly also not an option.
BUT the complex annotations worked. like. a. Charm. Awesome, I put so much work into searching for a solution and this is exactly what i was looking for  Thanks
1 Like


 Thanks