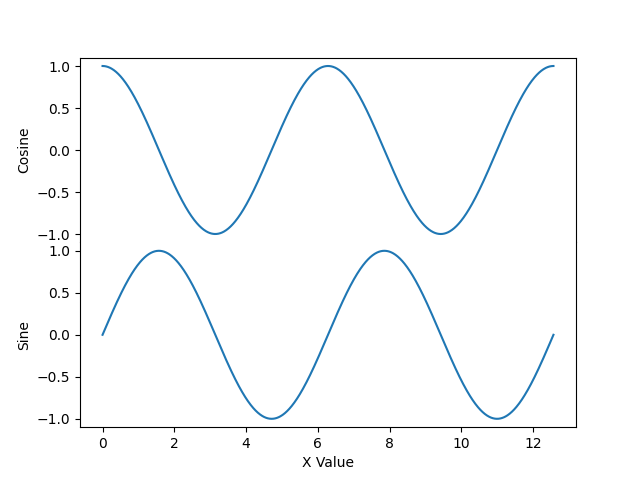
Hi, all. I’m creating a figure where I have a couple of vertically stacked plots for which I don’t want to use subplots because they share an x-axis. As such, I’d like to add multiple labels to the y-axis at certain y-coordinates so as to delineate which part of the graph is depicting what. Here’s a super silly example of the kind of plot I’d like to be able to make:
Here’s the basis for the plot:
import numpy as np
import matplotlib.pyplot as plt

fig = plt.figure()
axis = plt.gca()

axis.plot(x, y1)
axis.plot(x, y2+4)
axis.set_yticks([-1, 0, 1, 3, 4, 5])
axis.set_yticklabels([-1, 0, 1, -1, 0, 1])
axis.set_xlabel('X Value')
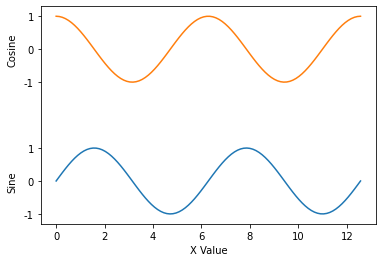
…and then, to add the y-axis labels, I’ve been doing something like this to get the left-most bounding box coordinate for the tick labels and then create text artists in the right place:
import matplotlib.axis as ax

transform1 = next(i.label1.get_transform() for i in axis.yaxis.get_children() if isinstance(i, ax.YTick))
ylabel_x = min(t.label1.get_window_extent(fig.canvas.renderer).transformed(transform1.inverted()).get_points()[0, 0] for t in axis.yaxis.get_children() if isinstance(t, ax.YTick))-0.05
ylabel1 = fig.text(ylabel_x, 0, 'Sine', transform=transform1, rotation='vertical', verticalalignment='center')
ylabel2 = fig.text(ylabel_x, 4, 'Cosine', transform=transform1, rotation='vertical', verticalalignment='center')
If I try to do this instead with the transform used to draw the y-axis label (which I have not set here), I run into this issue, whereby the coordinates of the axis label change sometime after I get them:
import matplotlib.transforms as tr

axis.set_ylabel('ylabel')
transform2 = tr.blended_transform_factory(axis.yaxis.label.get_transform(), axis.transData)
ylabel_x = axis.yaxis.label.get_position()[0]
ylabel1 = fig.text(ylabel_x, 0, 'Sine', transform=transform2, rotation='vertical', verticalalignment='center')
ylabel2 = fig.text(ylabel_x, 4, 'Cosine', transform=transform2, rotation='vertical', verticalalignment='center')
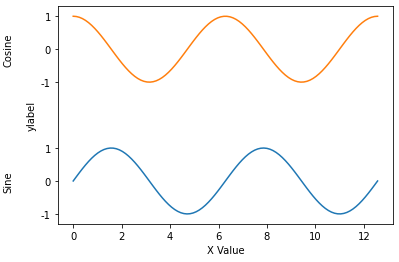
In this example, “Sine” and “Cosine” end up set too far to the left. The answer in the linked question suggests using an Annotation to achieve this, but I’m not sure how to specify that the x-offset from the label should be 0 while also specifying the y-coordinate in data coordinates (the solution in the linked question passes axis.yaxis.label to the kwarg xycoords of axis.annotate). Maybe I need to anchor the x-coordinate to the y-label’s artist and the y-coordinate to the tick label’s artist? Any suggestions here would be welcome, and thanks!