Thanks to point to this scikit, but I looked into the lib.plotlib
module, and I didn't manage to find something looking like the 'zoom
effect' Chaco provides...
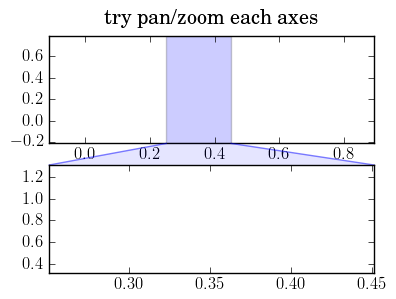
I merely wanted to add a Polygon patch between the upper and the lower
subplots, but using data coordinates from these axes.
···
Le lundi 29 juin 2009 à 07:51 -0400, Pierre GM a écrit :
Check the plotting routines in scikits.timeseries
(pytseries.sourceforge.net), there's some zooming functions that could
get you started.
--
Fabrice Silva <[email protected]...>
LMA UPR CNRS 7051
I have been wondering the same issue whether Chaco's nice zoom plot
could be made possible in Matplotlib. I don't have an answer for this
yet. If you come up with one, please let me know.
In the mean time, you can take a look at: http://www.simile-widgets.org/
They have some interesting and eye-catching time-series plots for
web-demonstrations.
Gökhan
···
On Mon, Jun 29, 2009 at 7:39 AM, Fabrice Silva<[email protected]...> wrote:
Le lundi 29 juin 2009 à 07:51 -0400, Pierre GM a écrit :
Check the plotting routines in scikits.timeseries
(pytseries.sourceforge.net), there's some zooming functions that could
get you started.
Thanks to point to this scikit, but I looked into the lib.plotlib
module, and I didn't manage to find something looking like the 'zoom
effect' Chaco provides...
I merely wanted to add a Polygon patch between the upper and the lower
subplots, but using data coordinates from these axes.
--
One more precision : my intent is to draw a figure 'statically', I do
not need event handling, ie handling manual zoom through an interactive
backend. The figure is generated from a script and directly saved
without human interaction.
···
Le lundi 29 juin 2009 à 14:39 +0200, Fabrice Silva a écrit :
I merely wanted to add a Polygon patch between the upper and the lower
subplots, but using data coordinates from these axes.
--
Fabrice Silva <[email protected]...>
LMA UPR CNRS 7051
Have you looked at the examples/widgets/span_selector.py demo?
Ryan
···
On Mon, Jun 29, 2009 at 12:12 PM, Gökhan SEVER <gokhansever@…287…> wrote:
On Mon, Jun 29, 2009 at 7:39 AM, Fabrice Silva<silva@…1918…> wrote:
Le lundi 29 juin 2009 à 07:51 -0400, Pierre GM a écrit :
Check the plotting routines in scikits.timeseries
(pytseries.sourceforge.net), there’s some zooming functions that could
get you started.
Thanks to point to this scikit, but I looked into the lib.plotlib
module, and I didn’t manage to find something looking like the 'zoom
effect’ Chaco provides…
I merely wanted to add a Polygon patch between the upper and the lower
subplots, but using data coordinates from these axes.
–
I have been wondering the same issue whether Chaco’s nice zoom plot
could be made possible in Matplotlib. I don’t have an answer for this
yet. If you come up with one, please let me know.
–
Ryan May
Graduate Research Assistant
School of Meteorology
University of Oklahoma
I think the issue here is to connect points in two different axes,
which is possible but can be a bit difficult.
In the svn version of matplotlib, there are some helper classes to
ease this job a bit.
I'm attaching the example.
I think you can also run the example with 0.98.5.3. Just download
inset_locator.py and modify your import statement.
Regards,
-JJ
demo_bbox_connector.py (2.32 KB)
···
On Mon, Jun 29, 2009 at 1:22 PM, Fabrice Silva<[email protected]...> wrote:
Le lundi 29 juin 2009 à 14:39 +0200, Fabrice Silva a écrit :
I merely wanted to add a Polygon patch between the upper and the lower
subplots, but using data coordinates from these axes.
One more precision : my intent is to draw a figure 'statically', I do
not need event handling, ie handling manual zoom through an interactive
backend. The figure is generated from a script and directly saved
without human interaction.
--
Fabrice Silva <[email protected]...>
LMA UPR CNRS 7051
------------------------------------------------------------------------------
_______________________________________________
Matplotlib-users mailing list
[email protected]
matplotlib-users List Signup and Options
I think the issue here is to connect points in two different axes,
which is possible but can be a bit difficult.
That was my problem
In the svn version of matplotlib, there are some helper classes to
ease this job a bit.
Thanks for your pointer. Sadly the mpl.toolkits.axes_grid is not shipped
by debian package, and downloading it requires other stuff. So I adapted
from the inset_locator.py the attached file.
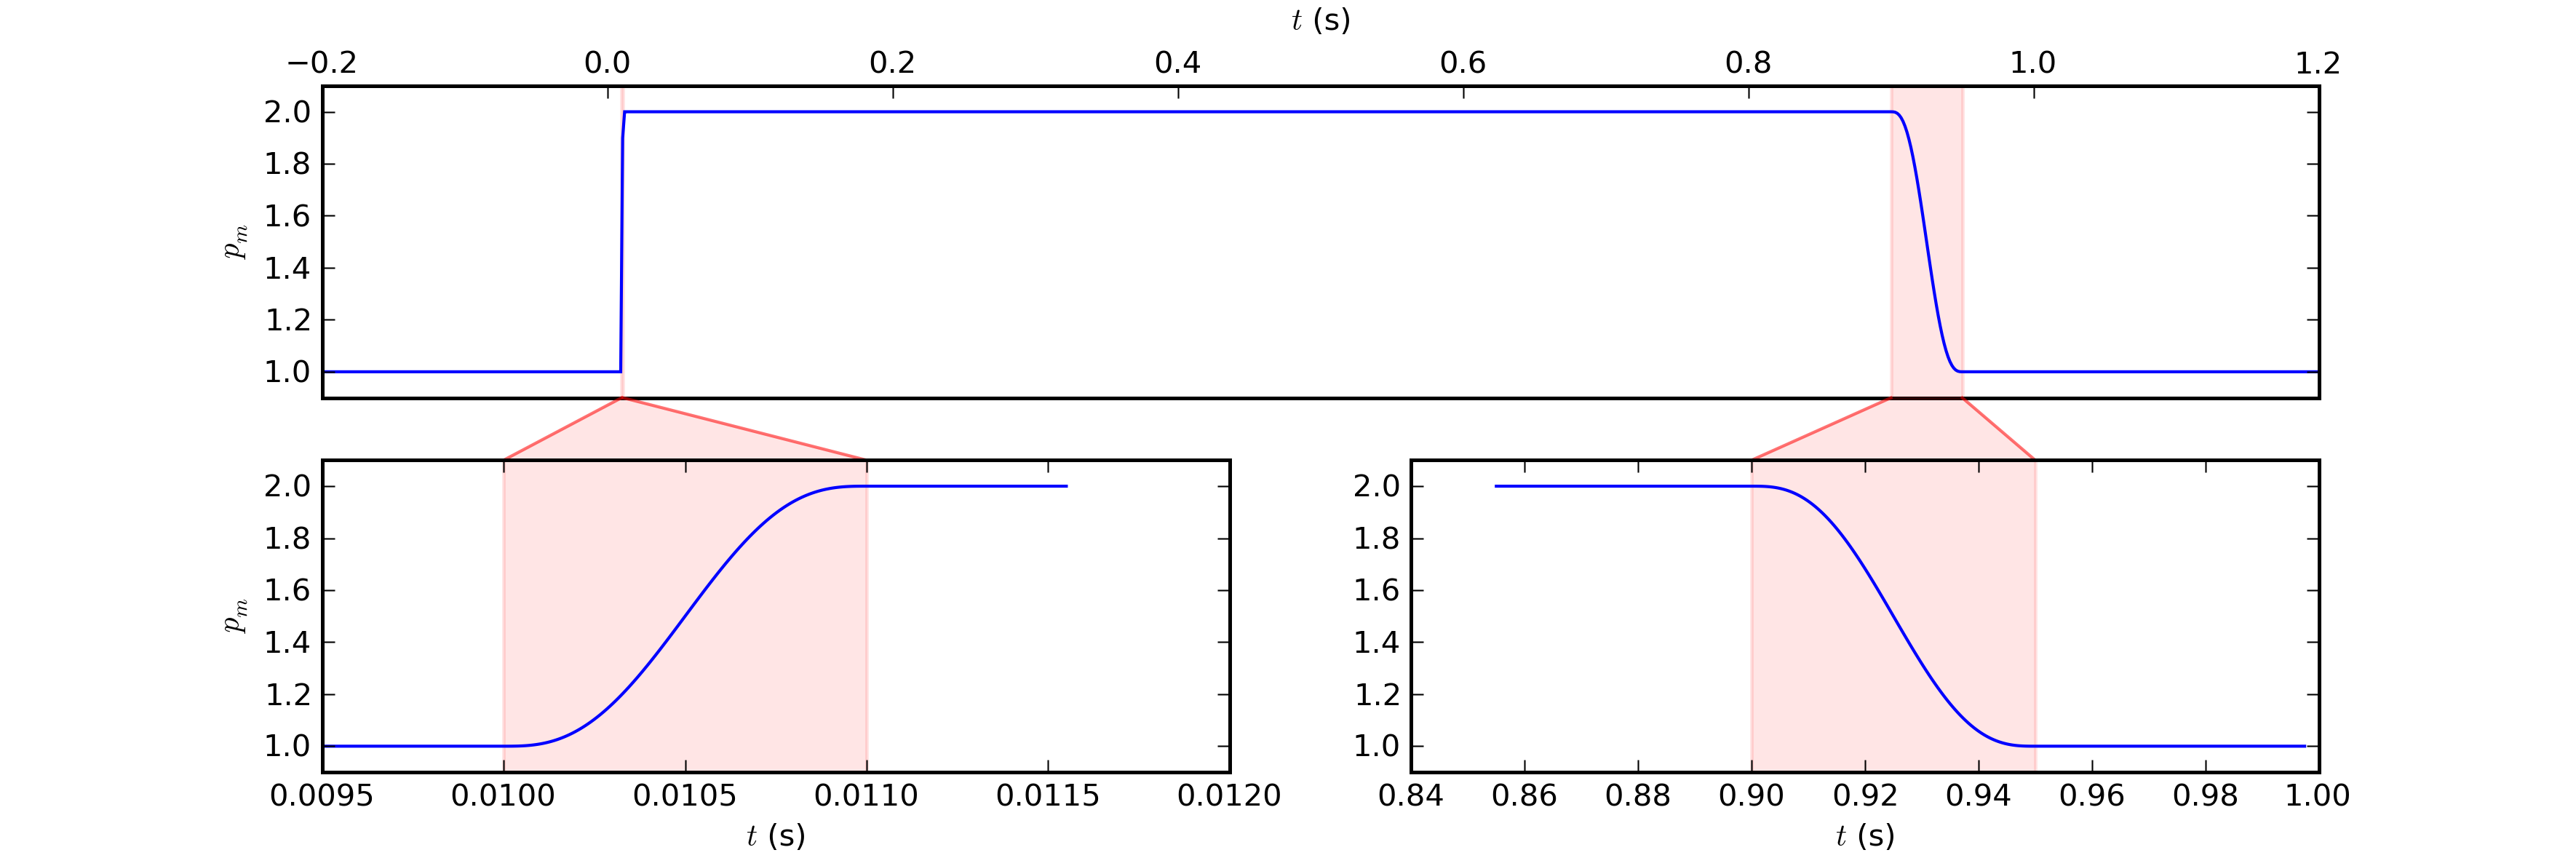
Finally I can "zoom" with the mere script :
import matplotlib.pyplot as plt
from mpl_axes_grid_inset_locator import zoom_effect
S1 = plt.subplot(211)
S1.plot(... # xlim (0.,1.2)
S2 = plt.subplot(223)
S2.plot(... # xlim (0.0095,.012)
S3 = plt.subplot(224)
S3.plot(... # xlim (0.84,1.)
# Labels stuff
# [...]
patch_props=dict(ec="r", alpha=0.5, fc="r")
zoom_effect(S1,S2, 0.01, 0.011, **patch_props)
zoom_effect(S1,S3, 0.90, 0.95, **patch_props)
It produces two zoom subplots with the wanted patch.
mpl_axes_grid_inset_locator.py (4.48 KB)
···
Le lundi 29 juin 2009 à 16:11 -0400, Jae-Joon Lee a écrit :
Hi Fabrice,
Good to hear that you were able to get it work.
Here is some tweak on transforms.
This way, the plot is shown correctly even if you change the y-limits of axes.
trans0 = blended_transform_factory(ax0.transData, ax0.transAxes)
trans1 = blended_transform_factory(ax1.transData, ax1.transAxes)
bbox = Bbox.from_extents(xmin, 0, xmax, 1)
mybbox1 = TransformedBbox(bbox, trans0)
mybbox2 = TransformedBbox(bbox, trans1)
I think the code is worth to be included as an mpl example.
I'll push this into the svn if you don't mind.
Regards,
-JJ
···
On Tue, Jun 30, 2009 at 8:12 AM, Fabrice Silva<[email protected]...> wrote:
Le lundi 29 juin 2009 à 16:11 -0400, Jae-Joon Lee a écrit :
I think the issue here is to connect points in two different axes,
which is possible but can be a bit difficult.
That was my problem
In the svn version of matplotlib, there are some helper classes to
ease this job a bit.
Thanks for your pointer. Sadly the mpl.toolkits.axes_grid is not shipped
by debian package, and downloading it requires other stuff. So I adapted
from the inset_locator.py the attached file.
Finally I can "zoom" with the mere script :
import matplotlib.pyplot as plt
from mpl_axes_grid_inset_locator import zoom_effect
S1 = plt.subplot(211)
S1.plot(... # xlim (0.,1.2)
S2 = plt.subplot(223)
S2.plot(... # xlim (0.0095,.012)
S3 = plt.subplot(224)
S3.plot(... # xlim (0.84,1.)
# Labels stuff
# [...]
   patch\_props=dict\(ec="r", alpha=0\.5, fc="r"\)
   zoom\_effect\(S1,S2, 0\.01, 0\.011, \*\*patch\_props\)
   zoom\_effect\(S1,S3, 0\.90, 0\.95, \*\*patch\_props\)
It produces two zoom subplots with the wanted patch.
------------------------------------------------------------------------------
_______________________________________________
Matplotlib-users mailing list
[email protected]
matplotlib-users List Signup and Options
I'm the debian maintainer for matplotlib: if you need something
missing in Debian, get in touch with us, for example reporting a bug
against matplotlib requesting this toolkit.
I didn't check further, but probably it was not release because of
this phrase: "In the svn version of matplotlib".
Regards,
···
On Tue, Jun 30, 2009 at 14:12, Fabrice Silva<[email protected]...> wrote:
Le lundi 29 juin 2009 à 16:11 -0400, Jae-Joon Lee a écrit :
In the svn version of matplotlib, there are some helper classes to
ease this job a bit.
Thanks for your pointer. Sadly the mpl.toolkits.axes_grid is not shipped
by debian package, and downloading it requires other stuff. So I adapted
--
Sandro Tosi (aka morph, morpheus, matrixhasu)
My website: http://matrixhasu.altervista.org/
Me at Debian: http://wiki.debian.org/SandroTosi
Hi Sandro,
thanks for packaging matplotlib for debian. I hope you did not
understand my words as a blame. In fact mpl_toolkits.axes_grid is still
in svn only and not in 0.98.x
I tried to download the mpl.toolkits.axes_grid module files, but I had
errors raising when importing that...
···
Le mercredi 01 juillet 2009 à 10:13 +0200, Sandro Tosi a écrit :
On Tue, Jun 30, 2009 at 14:12, Fabrice Silva<[email protected]...> wrote:
> Le lundi 29 juin 2009 à 16:11 -0400, Jae-Joon Lee a écrit :
>> In the svn version of matplotlib, there are some helper classes to
>> ease this job a bit.
> Thanks for your pointer. Sadly the mpl.toolkits.axes_grid is not shipped
> by debian package, and downloading it requires other stuff. So I adapted
I'm the debian maintainer for matplotlib: if you need something
missing in Debian, get in touch with us, for example reporting a bug
against matplotlib requesting this toolkit.
I didn't check further, but probably it was not release because of
this phrase: "In the svn version of matplotlib".
--
Fabrice Silva <[email protected]...>
LMA UPR CNRS 7051
Hi Fabrice,
Good to hear that you were able to get it work.
Here is some tweak on transforms.
This way, the plot is shown correctly even if you change the y-limits of axes.
trans0 = blended_transform_factory(ax0.transData, ax0.transAxes)
trans1 = blended_transform_factory(ax1.transData, ax1.transAxes)
bbox = Bbox.from_extents(xmin, 0, xmax, 1)
mybbox1 = TransformedBbox(bbox, trans0)
mybbox2 = TransformedBbox(bbox, trans1)
Thanks for these suggestions, I'll try on monday.
I think the code is worth to be included as an mpl example.
I'll push this into the svn if you don't mind.
Great ! I assume a BSD license...
···
Le mardi 30 juin 2009 à 13:21 -0400, Jae-Joon Lee a écrit :
--
Fabrice Silva <[email protected]...>
LMA UPR CNRS 7051 - équipe S2M