I am having a weird problem zooming in on a graph using
ylim(ymin,ymax). The data is all positive. I am trying to search for
local minimums of a function of one variable. So, I evaluate the
function over a vector and look graphically for local minimums to use
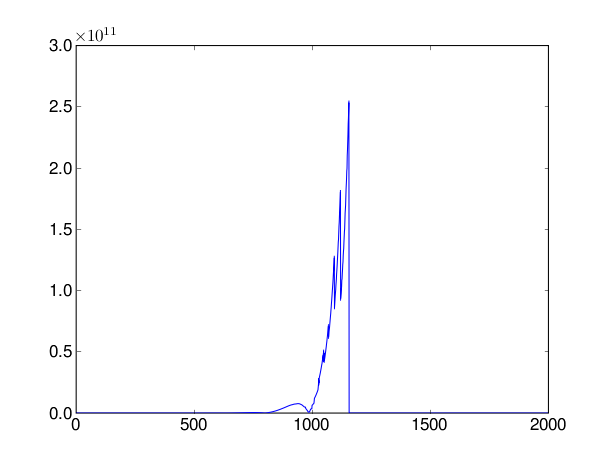
as initial guesses to scipy.optimize.fmin. If I plot all of the data,
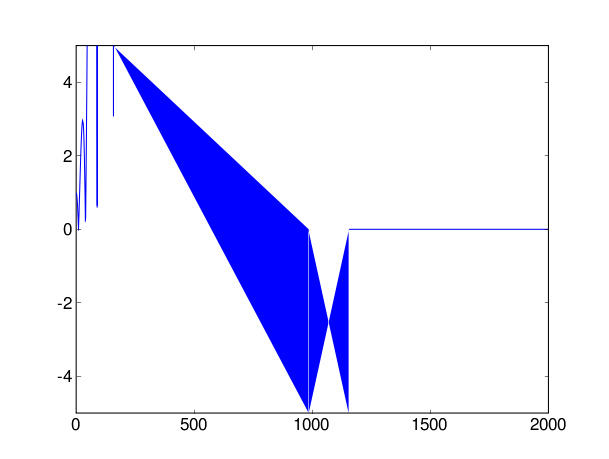
it looks like the attached file zoomout.png. But if I try and zoom in
using ylim, I get the rather strange looking plot in zoomin.png. Some
of the data is negative on the plot even though min(yvector)==0.0. I
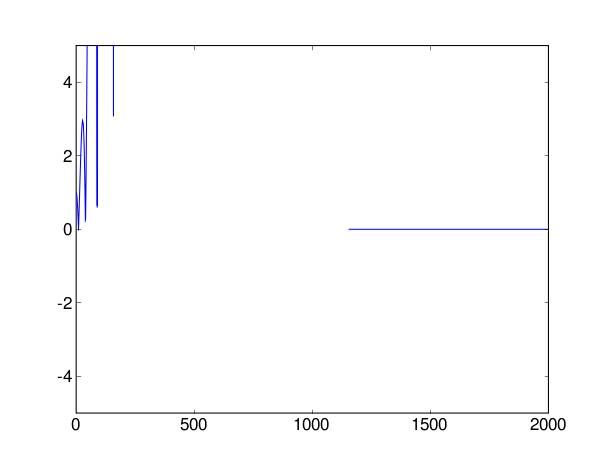
can sort of fixe the problem using masked arrays (zoommasked.png), but
I would like to have vertical lines going up to the masked values -
like would be there if I could just zoom in correctly.
I am using matplotlib cvs from some time last week, scipy 0.4.5.1579,
and numpy 0.9.5.2043 and numerix=numpy.
What am I going wrong or is this a bug?
Thanks,
Ryan