This is plotting values against the zero-based index. What you want is
plt.plot(d.keys(), d.values())
···
On 09/17/2011 09:57 AM, Klonuo Umom wrote:
plt.xticks(d.keys())
plt.show()
As it can be seen from attached screenshot, xticks values are shifted to
right (by 1).
Seems strange, but perhaps something to do with Python 0-start.
So why plot starts at beginning of x-axis and xticks start shifted by 1?
How does regular matplotlib users handle similar code?
Thanks
------------------------------------------------------------------------------
BlackBerry® DevCon Americas, Oct. 18-20, San Francisco, CA http://p.sf.net/sfu/rim-devcon-copy2
When you called plot() with only the y values, mpl will assume x values as range(len(y)). Just call plot with both x and y values.
Ben Root
···
On Saturday, September 17, 2011, Klonuo Umom <klonuo@…287…> wrote:
Hi,
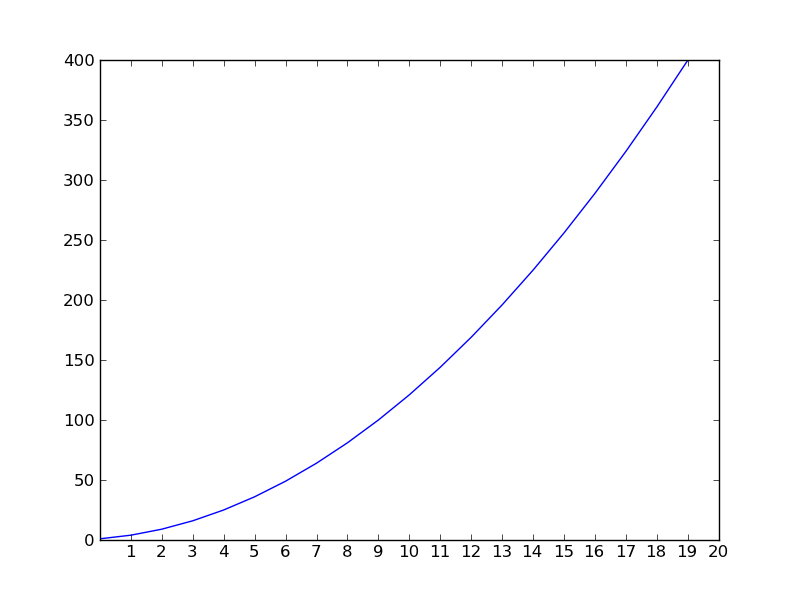
please consider this snippet:
import matplotlib.pyplot as plt
d={}
for i in range(1,21):
d[i] = i**2
plt.plot(d.values())
plt.xticks(d.keys())
plt.show()
As it can be seen from attached screenshot, xticks values are shifted to right (by 1).
Seems strange, but perhaps something to do with Python 0-start.
So why plot starts at beginning of x-axis and xticks start shifted by 1?
How does regular matplotlib users handle similar code?
Thanks