I'm having a strange problem and I don't understand why this is
happening. I am plotting the dataframe in: http://pastebin.com/C0Pt0iYd
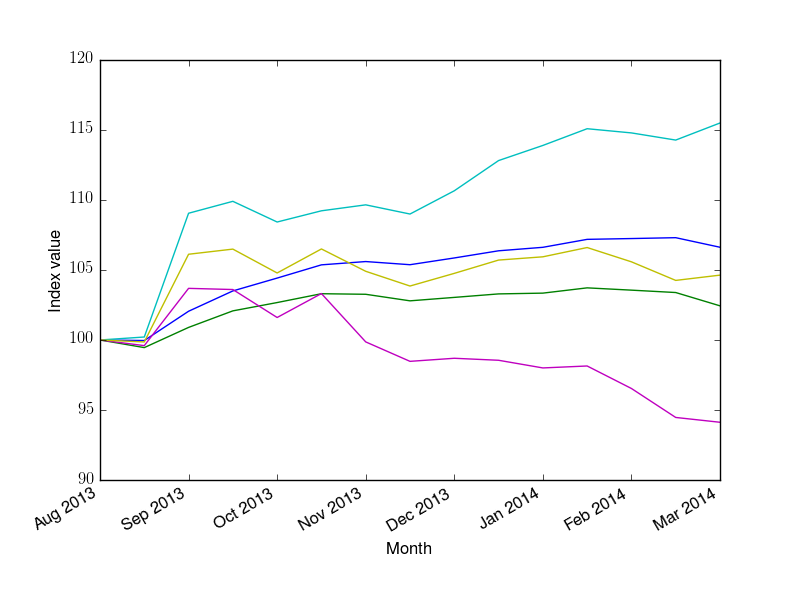
but I'm getting too few tick marks. My code for the plot is:
Why are you calling ax.set_xticklabels()?. Why not pass the x values to ax.plot() along with the y values? Then you won’t need to set the labels because matplotlib will do it for you.
Ben Root
···
On Wed, Jun 17, 2015 at 10:13 AM, Ted To <rainexpected@…3956…> wrote:
Hi,
I’m having a strange problem and I don’t understand why this is
Unless I recall incorrectly, I think I am using set_xticklabels because indices.index are strings. When I tried specifying ax.plot(indices.index,indices.carli) I get a ValueError.
Ted
···
On 2015-06-17 10:28 am, Benjamin Root wrote:
Why are you calling ax.set_xticklabels()?. Why not pass the x values
to ax.plot() along with the y values? Then you won't need to set the
labels because matplotlib will do it for you.
Ben Root
On Wed, Jun 17, 2015 at 10:13 AM, Ted To <rainexpected@...3956...> wrote:
_______________________________________________
Matplotlib-users mailing list
Matplotlib-users@lists.sourceforge.net matplotlib-users List Signup and Options [2]
Then convert them to date objects? Also, I am guessing that the length of indices.index is not the same as indices.carli, which could also be the reason for a ValueError. So you would need to use whatever pandas variable that indices.index derived from.
Ben Root
···
On Wed, Jun 17, 2015 at 12:48 PM, Ted To <rainexpected@…3956…> wrote:
Unless I recall incorrectly, I think I am using set_xticklabels because indices.index are strings. When I tried specifying ax.plot(indices.index,indices.carli) I get a ValueError.
Ted
On 2015-06-17 10:28 am, Benjamin Root wrote:
Why are you calling ax.set_xticklabels()?. Why not pass the x values
to ax.plot() along with the y values? Then you won’t need to set the
labels because matplotlib will do it for you.
Ben Root
On Wed, Jun 17, 2015 at 10:13 AM, Ted To <rainexpected@…3956…> wrote:
Hi,
I’m having a strange problem and I don’t understand why this is
Thank you, that worked. And also showed me why the xticks were mismatched -- apparently my index was not sorted.
···
On 2015-06-17 12:55 pm, Benjamin Root wrote:
Then convert them to date objects? Also, I am guessing that the length
of indices.index is not the same as indices.carli, which could also be
the reason for a ValueError. So you would need to use whatever pandas
variable that indices.index derived from.
Ben Root
On Wed, Jun 17, 2015 at 12:48 PM, Ted To <rainexpected@...3956...> wrote:
Unless I recall incorrectly, I think I am using set_xticklabels
because indices.index are strings. When I tried specifying
ax.plot(indices.index,indices.carli) I get a ValueError.
Ted
On 2015-06-17 10:28 am, Benjamin Root wrote:
Why are you calling ax.set_xticklabels()?. Why not pass the x
values
to ax.plot() along with the y values? Then you won't need to set
the
labels because matplotlib will do it for you.
Ben Root
On Wed, Jun 17, 2015 at 10:13 AM, Ted To <rainexpected@...3956...> >> wrote:
_______________________________________________
Matplotlib-users mailing list
Matplotlib-users@lists.sourceforge.net matplotlib-users List Signup and Options [2]
[2]