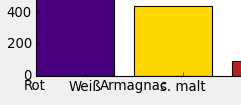
My lables for the different bars are not centered below the bar but are
all to the left side of the bars (lower left corner).
This is what I am basically doing:
axes = panel.figure.add_subplot(2, 2, 3)
…
    axes.bar(indx, values, color=colors)

    axes.set_xticklabels(labels)
I can not find how to provide the lables to the “bar” call or how else
to make sure that “Rot” is centered under the first bar, “Weiß” under
the second bar and so on.
Ideally I would like to have these labels printed at an angle.
Appreciate any hints
Werner
P.S.
mpl version: ‘0.99.0’
Python 2.5.2 on Vista
Werner F. Bruhin wrote:
...
Ideally I would like to have these labels printed at an angle.
Put my glasses on and found the rotation property in the documentation, only issue left is centering the labels below the bars.
Werner
Werner F. Bruhin wrote:
Werner F. Bruhin wrote:
...
Ideally I would like to have these labels printed at an angle.
Put my glasses on and found the rotation property in the documentation, only issue left is centering the labels below the bars.
Are you using the align='center' kwarg to bar()?
Eric
You need to adjust the positions of the ticks.
bar command (by default) creates boxes so that their left side
corresponds the first argument.
http://matplotlib.sourceforge.net/api/pyplot_api.html#matplotlib.pyplot.bar
so, in your case, something like below will work (0.4 from 0.8/2 where
0.8 is the default width of the bar).
axes.set_xticks([x+0.4 for x in indx])
Alternatively, bars can be center-aligned.
See the docs for more,
Also, take a look at the example below (there are bunch of other
examples in the gallery)
http://matplotlib.sourceforge.net/examples/pylab_examples/bar_stacked.html
-JJ
···
On Tue, Aug 18, 2009 at 1:29 PM, Werner F. Bruhin<[email protected]...> wrote:
My lables for the different bars are not centered below the bar but are all
to the left side of the bars (lower left corner).
This is what I am basically doing:
axes = panel\.figure\.add\_subplot\(2, 2, 3\)
...
axes.bar(indx, values, color=colors)
axes.set_xticklabels(labels)
I can not find how to provide the lables to the "bar" call or how else to
make sure that "Rot" is centered under the first bar, "Weiß" under the
second bar and so on.
Ideally I would like to have these labels printed at an angle.
Appreciate any hints
Werner
P.S.
mpl version: '0.99.0'
Python 2.5.2 on Vista
------------------------------------------------------------------------------
Let Crystal Reports handle the reporting - Free Crystal Reports 2008 30-Day
trial. Simplify your report design, integration and deployment - and focus
on
what you do best, core application coding. Discover what's new with
Crystal Reports now. http://p.sf.net/sfu/bobj-july
_______________________________________________
Matplotlib-users mailing list
[email protected]
matplotlib-users List Signup and Options
Eric,
Eric Firing wrote:
Werner F. Bruhin wrote:
Werner F. Bruhin wrote:
...
Ideally I would like to have these labels printed at an angle.
Put my glasses on and found the rotation property in the documentation, only issue left is centering the labels below the bars.
Are you using the align='center' kwarg to bar()?
No I did not, tried it but no change.
Werner
Jae-Joon Lee wrote:
You need to adjust the positions of the ticks.
bar command (by default) creates boxes so that their left side
corresponds the first argument.
http://matplotlib.sourceforge.net/api/pyplot_api.html#matplotlib.pyplot.bar
so, in your case, something like below will work (0.4 from 0.8/2 where
0.8 is the default width of the bar).
axes.set_xticks([x+0.4 for x in indx])
That does the trick. Thanks.
Although I wonder why "align='center'" does not work for me.
Will review the other samples and read the doc some more.
Werner