On Mon, Feb 21, 2011 at 1:32 PM, Waléria Antunes David > > <[email protected]... <mailto:[email protected]...>> wrote:
Can you help me...please.
On Mon, Feb 21, 2011 at 4:02 PM, Waléria Antunes David > > <[email protected]... <mailto:[email protected]...>> wrote:
I don't understand...i need that the yscale has these
values: 1,10,100,1000 ....But i don't know how...
Thanks,
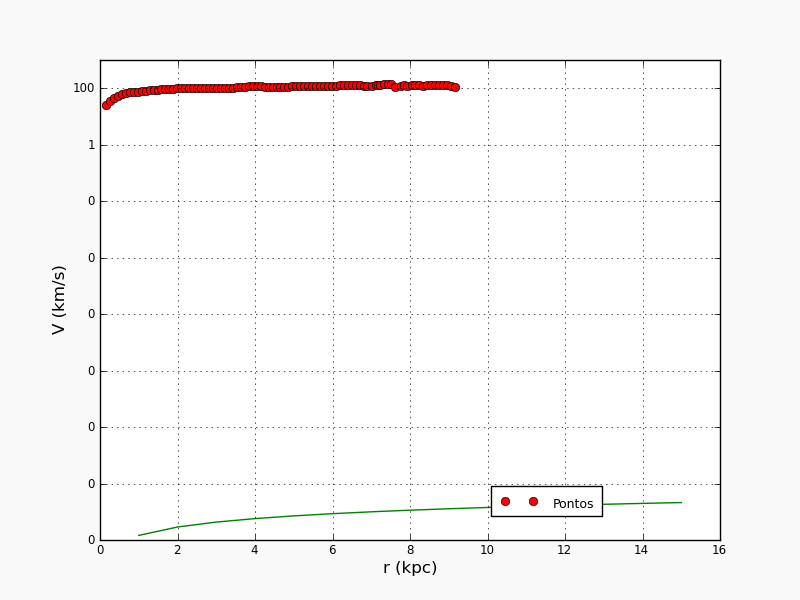
Let me make it clearer. Your green line has values on the order of
10^-17. There is nothing that can be done to meet your request if
you are plotting data this small. Either this data is wrong, or you
don't want to plot it at all.
To exclude anything less than 1, use the following:
ax.set_ylim(bottom=1)
Note that this will exclude the green line in your plot!
Ben Root
Index, Search& Analyze Logs and other IT data in Real-Time with Splunk
Collect, index and harness all the fast moving IT data generated by your
applications, servers and devices whether physical, virtual or in the cloud.
Deliver compliance at lower cost and gain new business insights.
I tried what Ben said: ax.set_ylim(bottom=1) ..., but changed nothing. See
my code: http://pastebin.com/Jt3BTp0C (line 14)
See my image generated - attached.
thanks,
On Tue, Feb 22, 2011 at 9:37 AM, Mike Kaufman <[email protected]...> wrote:
send me your data.
M
On 2/22/11 6:29 AM, Waléria Antunes David wrote:
See this pdf attached....the yscale has these values: 1, 10, 100, 1000
....I need this. My code: http://pastebin.com/HKCGQWez
Can you help me, please??
Thanks,
On Mon, Feb 21, 2011 at 4:41 PM, Benjamin Root <[email protected]... >>> <mailto:ben.root@…1304…>> wrote:
On Mon, Feb 21, 2011 at 1:32 PM, Waléria Antunes David >>> <[email protected]... <mailto:waleriantunes@…287…>> wrote:
   Can you help me\.\.\.please\.

   On Mon, Feb 21, 2011 at 4:02 PM, Waléria Antunes David >>>        <waleriantunes@\.\.\.287\.\.\. <mailto:[email protected]...>> wrote:

       I don't understand\.\.\.i need that the yscale has these
       values: 1,10,100,1000 \.\.\.\.But i don't know how\.\.\.

       Thanks,
Let me make it clearer. Your green line has values on the order of
10^-17. There is nothing that can be done to meet your request if
you are plotting data this small. Either this data is wrong, or you
don't want to plot it at all.
To exclude anything less than 1, use the following:
ax.set_ylim(bottom=1)
Note that this will exclude the green line in your plot!
Ben Root
------------------------------------------------------------------------------
Index, Search& Analyze Logs and other IT data in Real-Time with Splunk
Collect, index and harness all the fast moving IT data generated by your
applications, servers and devices whether physical, virtual or in the
cloud.
Deliver compliance at lower cost and gain new business insights.
Free Software Download: http://p.sf.net/sfu/splunk-dev2dev
------------------------------------------------------------------------------
Index, Search & Analyze Logs and other IT data in Real-Time with Splunk
Collect, index and harness all the fast moving IT data generated by your
applications, servers and devices whether physical, virtual or in the cloud.
Deliver compliance at lower cost and gain new business insights.
Free Software Download: http://p.sf.net/sfu/splunk-dev2dev
_______________________________________________
Matplotlib-users mailing list [email protected] matplotlib-users List Signup and Options