I am plotting a bar chart from a Pandas series with index:
CategoricalIndex([3, 4, 5, 6, 8], categories=[3, 4, 5, 6, 8], ordered=False, dtype=‘category’, name=‘cyl’)
The code I have for x-axis tick labels is as follows:
ax.set_xticks(avgMilesByCyl.index)
ax.set_xticklabels(labels=avgMilesByCyl.index, fontdict=tickFont)
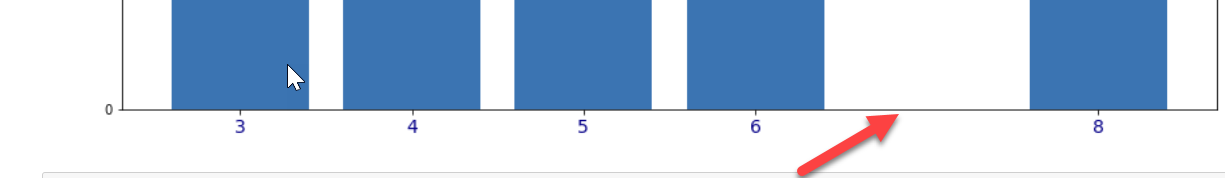
I want bars for the indexes 3, 4, 5, 6 and 8, but the chart has x-axis ticks for 3, 4, 5, 6, 7, 8, i.e. for 7 also. I have copy pasted an image below (not sure whether it will appear when I post).
I need help with suppressing the space left for 7 in the x-axis.