Thanks Josh this is much appreciated. I will definitely have a look at this approach.
Just for clarification, my code does only create the figures when the frame is initialised. The plots are then updated/cleared as required.
···
From:
Joshua Koehler [mailto:jjkoehler9@…287…]
Sent: Tuesday, 17 July 2012 12:12 a.m.
To: [email protected]
Subject: Re: [Matplotlib-users] wxpython matplotlib figure resize
Yes, my apologies for being a bit vague. Hopefully the following can help you out, but I can’t make promises. It did fix the issue for me.
First off, from reading other threads about handling figures, it might be better to use matplotlib.pylab.figure instead of matplotlib.figure. Apparently the former registers
the figure with a manager which allows for better cleanup.
Second, it looks to me from your code as if you are creating a figure every time a new plot is created. Is this correct? Or are these functions just called on startup?
If you are creating a new figure each time for a plot, (which is what I was originally doing) you should redesign so you keep the same figure and then just update the subplots. Clear the figure and then add the appropriate subplots. Here is a segment from
my code:
def plot(figure, rows, cols, graph, title):
figure.clear()
plt.figure(figure.number)
pos_counter = 1
for g in graph:
g.axes = figure.add_subplot(rows, cols, pos_counter)
if title:
g.axes.set_title(g.plot_title)
plot_nx(g, plot_options=g.plot_options)
pos_counter = pos_counter + 1
figure.canvas.draw()
plt is the pylab module from matplotlib and plot_nx is an internal call to networkx plotting capabiility (same as if you called the pyplot.plot). If you do use pylab,
make sure to include the plt.figure(figure.number) call as this seems to be a bug (or perhaps this just is with networkx integration).
This setup works for me rather well. I no longer have to manually resize anything.
I hope that helps. If not, I am at a loss for what would be a good way to proceed. I, probably like you, spent a long time trying to figure this one out and found this
to be the best solution. It might be good to go with the clunky mechanism since it works and wait until this is addressed later (if it is indeed a bug)
Regards,
Josh
On Jul 14, 2012, at 4:13 AM, Keith Jones wrote:
Hi Josh,
I am not quite sure what information you need, but I have an application with several wx notebooks, each with pages carrying related
but different 2D and 3D plots. I hope this overview covers what you want. In the code below I set up the axes and toolbar in each panel ready to accept plots as required. I use wxFormbuilder to create MyFrame1 and then this code to add graphs and other
functionality. The ‘tickle’ function is called when a notebook is selected for display.
import wx
from matplotlib.backends.backend_wxagg import FigureCanvasWxAgg as FigureCanvas
from matplotlib.backends.backend_wxagg import NavigationToolbar2WxAgg
from matplotlib.figure import Figure
from mpl_toolkits.mplot3d import Axes3D
class ProjectFrame(bare_gui.MyFrame1):
def __init__( self, parent):
bare_gui.MyFrame1.__init__( self, parent)
…
self.Create2DGraph(self.CT_graph_1, "Current / %")#CT notebook
self.Create2DGraph(self.VT_graph_1, "Voltage/ %")#VT notebook
…
self.Show(True)
def Create2DGraph(self, panel, xlabel):
panel.figure = Figure(None)
panel.canvas = FigureCanvas(panel, -1, panel.figure)
panel.axes1 = panel.figure.add_subplot(2,1,1)
panel.axes2 = panel.figure.add_subplot(2,1,2)
panel.axes1.set_xlabel(xlabel)
panel.axes1.set_ylabel('Error / %')
panel.axes2.set_xlabel(xlabel)
panel.axes2.set_ylabel('Phase / crad')
panel.sizer = wx.BoxSizer(wx.VERTICAL)
panel.sizer.Add(panel.canvas, 1, wx.LEFT | wx.TOP | wx.GROW)
panel.SetSizer(panel.sizer)
panel.Fit()
self.add_2Dtoolbar(panel)
def add_2Dtoolbar(self, panel):
panel.toolbar = NavigationToolbar2WxAgg(panel.canvas)
panel.toolbar.Realize()
tw, th = panel.toolbar.GetSizeTuple()
fw, fh = panel.canvas.GetSizeTuple()
panel.toolbar.SetSize(wx.Size(fw, th))
panel.sizer.Add(panel.toolbar, 0, wx.LEFT | wx.EXPAND)
# update the axes menu on the toolbar
panel.toolbar.update()
def Create3DGraph(self, panel):
panel.figure = Figure(None)
panel.canvas = FigureCanvas(panel, -1, panel.figure)
panel.ax = Axes3D(panel.figure)
#these labels should be selected later for specific components
panel.ax.set_xlabel('Current / %')
panel.ax.set_ylabel('Phase / degree')
panel.ax.set_zlabel('Error / %')
panel.sizer = wx.BoxSizer(wx.VERTICAL)
panel.sizer.Add(panel.canvas, 1, wx.LEFT | wx.TOP | wx.GROW)
panel.SetSizer(panel.sizer)
panel.Fit()
self.add_2Dtoolbar(panel)
From: Joshua
Koehler [jjkoehler9@…287…]
Sent: Friday, 13 July 2012 10:45 p.m.
To: [email protected]
Subject: Re: [Matplotlib-users] wxpython matplotlib figure resize
Hi Keith,
How are you storing the plot in the frame/panel?
Josh
On Jul 12, 2012, at 11:59 PM, Keith Jones wrote:
Hi Josh,
Yes I too am using the wx backend.
Regards,
Keith
From: Tony
Yu [mailto:tsyu80@…287…]
Sent: Friday, 13 July 2012 3:16 p.m.
To: Keith Jones
Cc: Joshua Koehler; [email protected]
Subject: Re: [Matplotlib-users] wxpython matplotlib figure resize
On Thu, Jul 12, 2012 at 9:27 PM, Keith Jones <K.Jones@…1546…> wrote:
Hi,
I am interested in a better solution to this problem, but I have used this simple method to force the right size.
def tickle(self):

    #gets frame to redraw and resize, not elegant.

    if self.IsMaximized(): #then needs a kick

        self.Restore()

        self.Maximize()

    else:

        x,y = self.GetSize()

        self.SetSize((x-1, y-1))

        self.SetSize((x, y))
Regards,
Keith
From: Joshua
Koehler [mailto:jjkoehler9@…287…]
Sent: Saturday, 7 July 2012 1:51 a.m.
To: [email protected]
Subject: [Matplotlib-users] wxpython matplotlib figure resize
Hi all,
I am currently trying to use matplotlib with wxPython and all is going well except for one annoying issue that I can’t figure out.
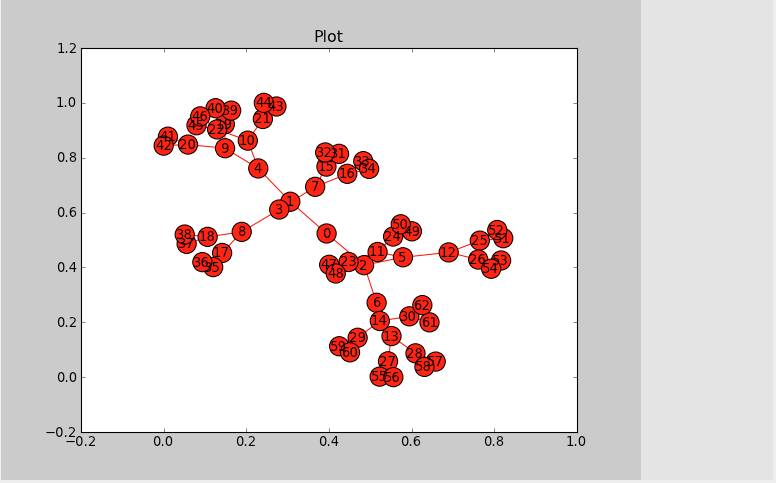
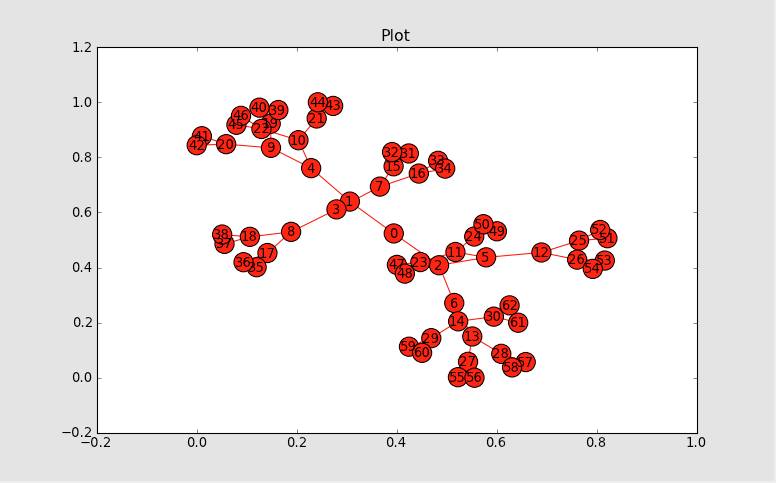
I initialize a wxcanvas object with a figure and then throughout the life of the program I want the canvas’ figure to change and display the corresponding plot. I can get the change of figure, but when the program goes to plot, the figure isn’t the right size.
It changes to the right size only when I manually resize the figure (see attached images). Is there some command that I am missing? This is the update sequence I am using:
self.figure = figure
    self.canvas.figure.clear()

    self.canvas.figure = self.figure

    self.canvas.draw()

    self.color_background()


    #self.GetParent().Layout()

    #self.SetSizer(self.main_sizer)

    #self.Fit()

    self.SendSizeEvent()
As you can tell from the comments (there are more in my code), I have tried a variety of ways to update the figure off the bat.
Thanks!
Josh
This may be similar to a Qt-backend bug, which didn’t take the toolbar into account when resizing the figure:
https://github.com/matplotlib/matplotlib/pull/756
It doesn’t quite fit, though, because Josh’s original example shows a figure that’s the correct size (but the axes doesn’t fill the figure).
The toolbar issue tended to squish the axes in the vertical direction (at least in the GUI window), whereas Josh’s example is squished in the horizontal direction.
Keith: Are you also using the Wx-backend? I don’t have Wx installed so I can’t provide much help. I’ve been planning to take a look at a similar
issue in the Tk backend, but haven’t had time.
Best,
-Tony
This electronic transmission and any documents accompanying this electronic transmission contain confidential information belonging to the sender. This information may be legally privileged. The information is intended only for the use of the individual or
entity named above. If you are not the intended recipient, you are hereby notified that any disclosure, copying, distribution or the taking of any action in reliance on or regarding the contents of this electronically transmitted information is strictly prohibited.