Hi,
I’m trying to add features into a 3d plot using voxels. I started from the example here: voxels numpy logo and I tried to add a flat surface at a defined z-level (probably I could have used other features but I’d like to have the “surface mesh” too). The code is reported below:
import numpy as np
import matplotlib.pyplot as plt

def explode(data):
    size = np.array(data.shape)*2
    data_e = np.zeros(size - 1, dtype=data.dtype)
    data_e[::2, ::2, ::2] = data
    return data_e

nx = 5
ny = 4
nz = 12

n_voxels = np.zeros((nx, ny, nz), dtype=bool)
n_voxels[:, :, :6] = True
facecolors = np.where(n_voxels, 'plum', 'skyblue')
edgecolors = np.where(n_voxels, 'plum', 'skyblue')
filled = np.ones(n_voxels.shape)

# upscale the above voxel image, leaving gaps
filled_2 = explode(filled)
fcolors_2 = explode(facecolors)
ecolors_2 = explode(edgecolors)

# Shrink the gaps
x, y, z = np.indices(np.array(filled_2.shape) + 1).astype(float) // 2
x[0::2, :, :] += 0.05
y[:, 0::2, :] += 0.05
z[:, :, 0::2] += 0.05
x[1::2, :, :] += 0.95
y[:, 1::2, :] += 0.95
z[:, :, 1::2] += 0.95

xs = np.arange(0.0, nx+1, 1.0)
ys = np.arange(0.0, ny+1, 1.0)
xsv, ysv = np.meshgrid(xs, ys)

R = np.sqrt(xsv**2 + ysv**2)

fig = plt.figure(figsize=(24,8))
ax = fig.add_subplot(projection='3d')

ax.voxels(x, y, z, filled_2, facecolors=fcolors_2, edgecolors=ecolors_2,alpha=0.5, antialiased=True)

surf = ax.plot_surface(xsv, ysv, np.zeros_like(R)+6, color='green',edgecolors='k', linewidth=1, antialiased=True, alpha=0.5)
ax.set_aspect('equal')

ax.axis('off')
fig.tight_layout()

plt.savefig('chunks.png', bbox_inches='tight')
plt.show()
and theresult is shown here:
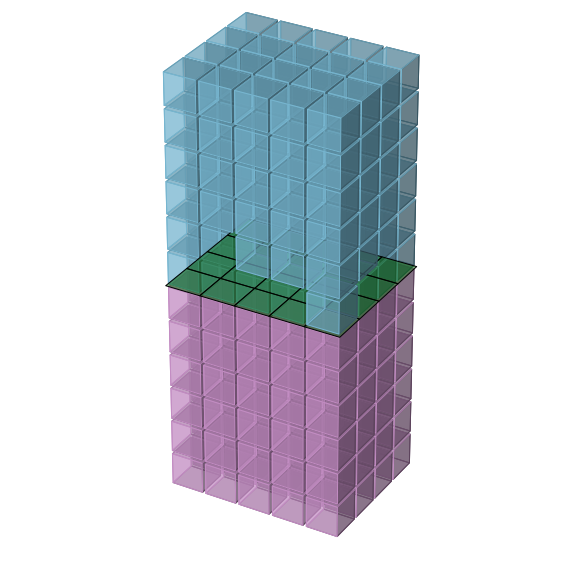
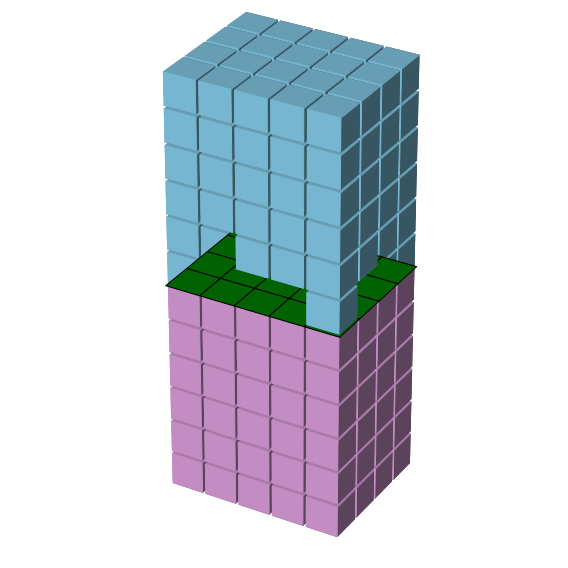
It looks like I have some issues in overlapping features, as the surface appears to be in front of some of the voxels (see the picture with alpha=1).
I haven’t found a way to set-up the proper order of the features. Possibly I am missing some documentation or reference.
Any help is much appreciated.
Thank you
Claudio