Hello,
I'm trying to use arrows but I'm a little stuck.
In [1]: import matplotlib
In [2]: matplotlib.__version__
Out[2]: '0.98.5.3'
First, simply
import matplotlib.pyplot as plt
plt.arrow(2,2,4,1)
doesn't show anything, while at least a figure with an arrow in is
expected (or it's by design?)
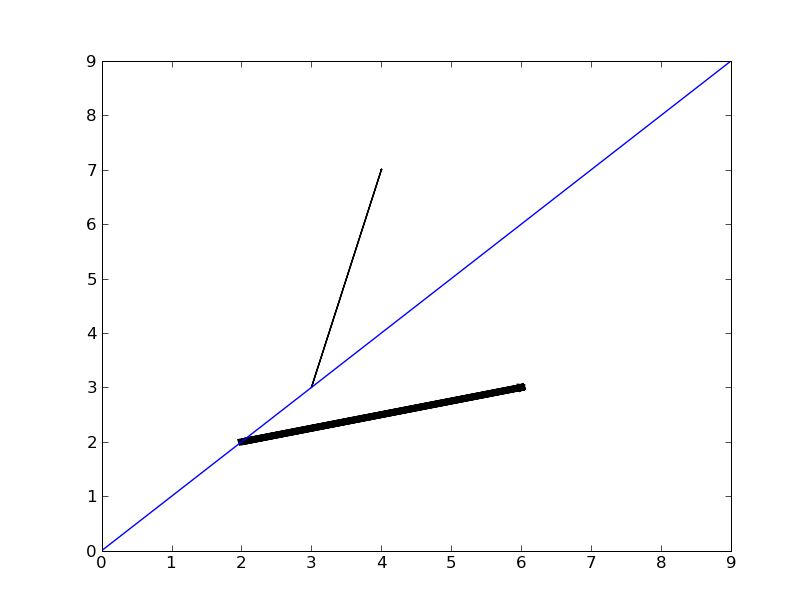
Secondly, with this simple script:
import matplotlib.pyplot as plt
plt.plot(range(10))
plt.arrow(2,2,4,1, linewidth=5)
plt.arrow(3,3,1,4)
the result is quite ugly  Where is the arrow pointer (for example)?
I hope I'm missing something, but even in examples like "usetex_demo"
the arrows are drawn "by hand"
Thanks,
···
--
Sandro Tosi (aka morph, morpheus, matrixhasu)
My website: http://matrixhasu.altervista.org/
Me at Debian: http://wiki.debian.org/SandroTosi
You need to adjust the keyword arguments, such as head_width, etc. The
arrow command itself is poorly documented and its keyword arguments
are explained in
matplitlib.patches.FancyArrow. However, I recommend you to use
annotate command instead of arrow (you can give empty string if you
just need an arrow). For example,
annotate("", (0.2, 0.2), (0.4, 0.4),
arrowprops=dict(arrowstyle="->"))
more examples,
http://matplotlib.sourceforge.net/examples/pylab_examples/annotation_demo.html
http://matplotlib.sourceforge.net/examples/pylab_examples/annotation_demo2.html
Annotate does not adjust the xlim and ylim of your axes for you, thus
it is your responsibility.
-JJ
···
On Wed, Mar 25, 2009 at 6:39 PM, Sandro Tosi <[email protected]...> wrote:
Hello,
I'm trying to use arrows but I'm a little stuck.
In [1]: import matplotlib
In [2]: matplotlib.__version__
Out[2]: '0.98.5.3'
First, simply
import matplotlib.pyplot as plt
plt.arrow(2,2,4,1)
doesn't show anything, while at least a figure with an arrow in is
expected (or it's by design?)
Secondly, with this simple script:
import matplotlib.pyplot as plt
plt.plot(range(10))
plt.arrow(2,2,4,1, linewidth=5)
plt.arrow(3,3,1,4)
the result is quite ugly Where is the arrow pointer (for example)?
I hope I'm missing something, but even in examples like "usetex_demo"
the arrows are drawn "by hand"
Thanks,
--
Sandro Tosi (aka morph, morpheus, matrixhasu)
My website: http://matrixhasu.altervista.org/
Me at Debian: http://wiki.debian.org/SandroTosi
------------------------------------------------------------------------------
_______________________________________________
Matplotlib-users mailing list
[email protected]
matplotlib-users List Signup and Options
Hi Jae-Joon,
thanks for the reply.
You need to adjust the keyword arguments, such as head_width, etc. The
But shouldn't the default arrow be a little bit "nicer" than it's now?
arrow command itself is poorly documented and its keyword arguments
are explained in
matplitlib.patches.FancyArrow.
Ah, that's why even in pyploy.arrow() I could'nt find eny reference to
head_width & friends. In case I have some time to share on improve
arrow() docs, what docs should I look to? and changing
'doc/api/pyplot_api.rst' is the right place to achieve it?
However, I recommend you to use
annotate command instead of arrow (you can give empty string if you
just need an arrow). For example,
annotate("", (0.2, 0.2), (0.4, 0.4),
arrowprops=dict(arrowstyle="->"))
more examples,
http://matplotlib.sourceforge.net/examples/pylab_examples/annotation_demo.html
http://matplotlib.sourceforge.net/examples/pylab_examples/annotation_demo2.html
I already treated annotation, but I would like to give the readers (of
the book) a much wider toolbox, so introducing bare arrows after
annotations seems straigthforward.
Annotate does not adjust the xlim and ylim of your axes for you, thus
it is your responsibility.
Yep, already noticed 
Cheers,
···
On Thu, Mar 26, 2009 at 02:51, Jae-Joon Lee <[email protected]...> wrote:
--
Sandro Tosi (aka morph, morpheus, matrixhasu)
My website: http://matrixhasu.altervista.org/
Me at Debian: http://wiki.debian.org/SandroTosi
Have you seen the arrow and fancy arrow demos
http://matplotlib.sourceforge.net/examples/pylab_examples/arrow_demo.html
http://matplotlib.sourceforge.net/examples/pylab_examples/fancyarrow_demo.html
Both of these use older and less sophisticated arrows that JJ’s FancyArrowPatch
http://matplotlib.sourceforge.net/api/artist_api.html?highlight=fancyarrowpatch#matplotlib.patches.FancyArrowPatch
so perhaps the best thing for you to do would be to write an example using the FancyArrowPatch directly.
JDH
···
On Thu, Mar 26, 2009 at 9:59 AM, Sandro Tosi <morph@…10…> wrote:
Hi Jae-Joon,
thanks for the reply.
On Thu, Mar 26, 2009 at 02:51, Jae-Joon Lee <lee.j.joon@…287…> wrote:
You need to adjust the keyword arguments, such as head_width, etc. The
But shouldn’t the default arrow be a little bit “nicer” than it’s now?
arrow command itself is poorly documented and its keyword arguments
are explained in
matplitlib.patches.FancyArrow.
Ah, that’s why even in pyploy.arrow() I could’nt find eny reference to
head_width & friends. In case I have some time to share on improve
arrow() docs, what docs should I look to? and changing
‘doc/api/pyplot_api.rst’ is the right place to achieve it?
However, I recommend you to use
annotate command instead of arrow (you can give empty string if you
just need an arrow). For example,
annotate(“”, (0.2, 0.2), (0.4, 0.4),
arrowprops=dict(arrowstyle="->"))
more examples,
http://matplotlib.sourceforge.net/examples/pylab_examples/annotation_demo.html
http://matplotlib.sourceforge.net/examples/pylab_examples/annotation_demo2.html
I already treated annotation, but I would like to give the readers (of
the book) a much wider toolbox, so introducing bare arrows after
annotations seems straigthforward.