Lionel
I have encountered a problem with windrose. In some cases, one or more
of the
wind direction values are null [''] - the program then fails on line
200:
values = select( [greater_equal( direction, wind_classes[i]
)],[speed], default=-1.e20 )
Is it possible for you to upgrade the program to perform error
trapping
and simply skip (i.e. not process) any values that are null (and handle
the
exceptional case that all of them might, in fact, be null).
Thanks!
Derek
Lionel Roubeyrie <lroubeyrie@...1068...> 2006/10/18 05:57:55 PM
Hi Derek,
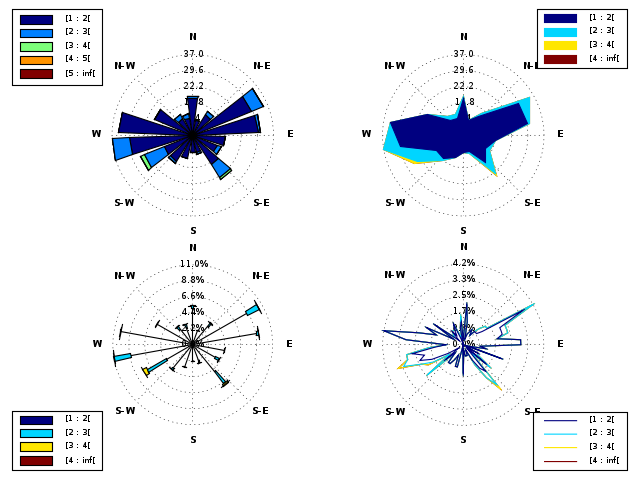
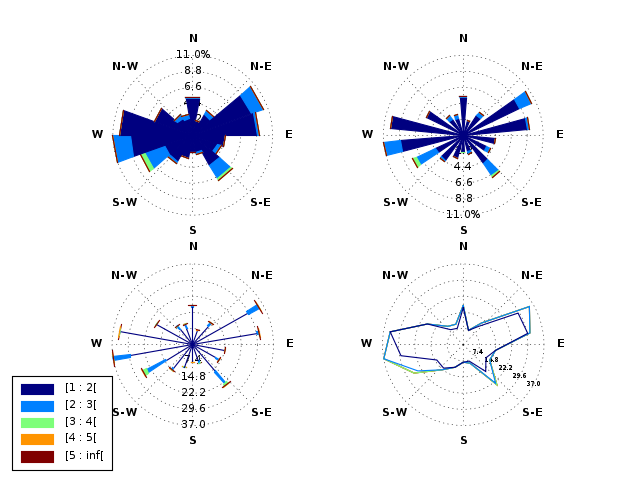
happy to see you use it, here is windrose0.5 with some improvments 
* do not outline the colors in black; its hard to see
smaller/shorter
lines
Done
* the % labels need either to go along a vector NOT used to draw
data,
or
be drawn last (on top of data); or a combination of both
Now "%" is set with the external label. I don't find how to set labels
(and
grids) above patches, ax.set_axisbelow(False) doesn't work  But for
the
moment you can use labangle parameter to move the labels.
* the 0.0% label can probably be omitted from the centre
* drawing a title("") on the plot is still problematic (it
overwrites
the "N" in some cases)
0.0 is not longer draw
* default background color should be white
Hum, everybody can set it directly from matplotlibrc or creating an
polar axis
before.
* a legend title will *very* useful
Waiting for polar axes legend improvments
And a question - is it possible to restrict the plot to a portion of
the area;
say to the left, with a "rectangle" of the space available to the
right; or
up to the top, with a "rectangle" of the space available to the
bottom.
Plots often have to annotated and its useful to have some working
space
to do this.
Don't know if I really understand what you want, but why don't you use
subplot
to split your figures?
Thanks for all the good work!
Derek
PS Does anyone else using this program get the strange "[" and "]"
signs around the data ranges in the legend - how can this be turned
off?
You're the first saying you use it
Maybe differents progs versions. I use:
datas>[42]>matplotlib.__version__
Out [42]:'0.87.5'
datas>[43]>scipy.__version__
Out [43]:'0.5.1'
datas>[44]>numpy.__version__
Out [44]:'1.0b5'
Lionel
···
--
Lionel Roubeyrie - lroubeyrie@...1068...
LIMAIR
http://www.limair.asso.fr
--
This message is subject to the CSIR's copyright, terms and conditions and
e-mail legal notice. Views expressed herein do not necessarily represent the
views of the CSIR.
CSIR E-mail Legal Notice
http://mail.csir.co.za/CSIR_eMail_Legal_Notice.html
CSIR Copyright, Terms and Conditions
http://mail.csir.co.za/CSIR_Copyright.html
For electronic copies of the CSIR Copyright, Terms and Conditions and the CSIR
Legal Notice send a blank message with REQUEST LEGAL in the subject line to
CallCentre@...1230...
This message has been scanned for viruses and dangerous content by MailScanner,
and is believed to be clean.