I want to replot a Geosubplot. use code:
        global ax_0
        ax_0.cla()

        new_show_crs = proection_show.gennewccrs(data=data)

        ax_0 = fig.add_subplot(121, projection=new_show_crs)
        # ax_0.stock_img()
        ax_0.background_img()
        ax_0.coastlines(resolution='110m')
        ax_0.gridlines(
        )
but it very slowly when I add above code in a motion_notify_event
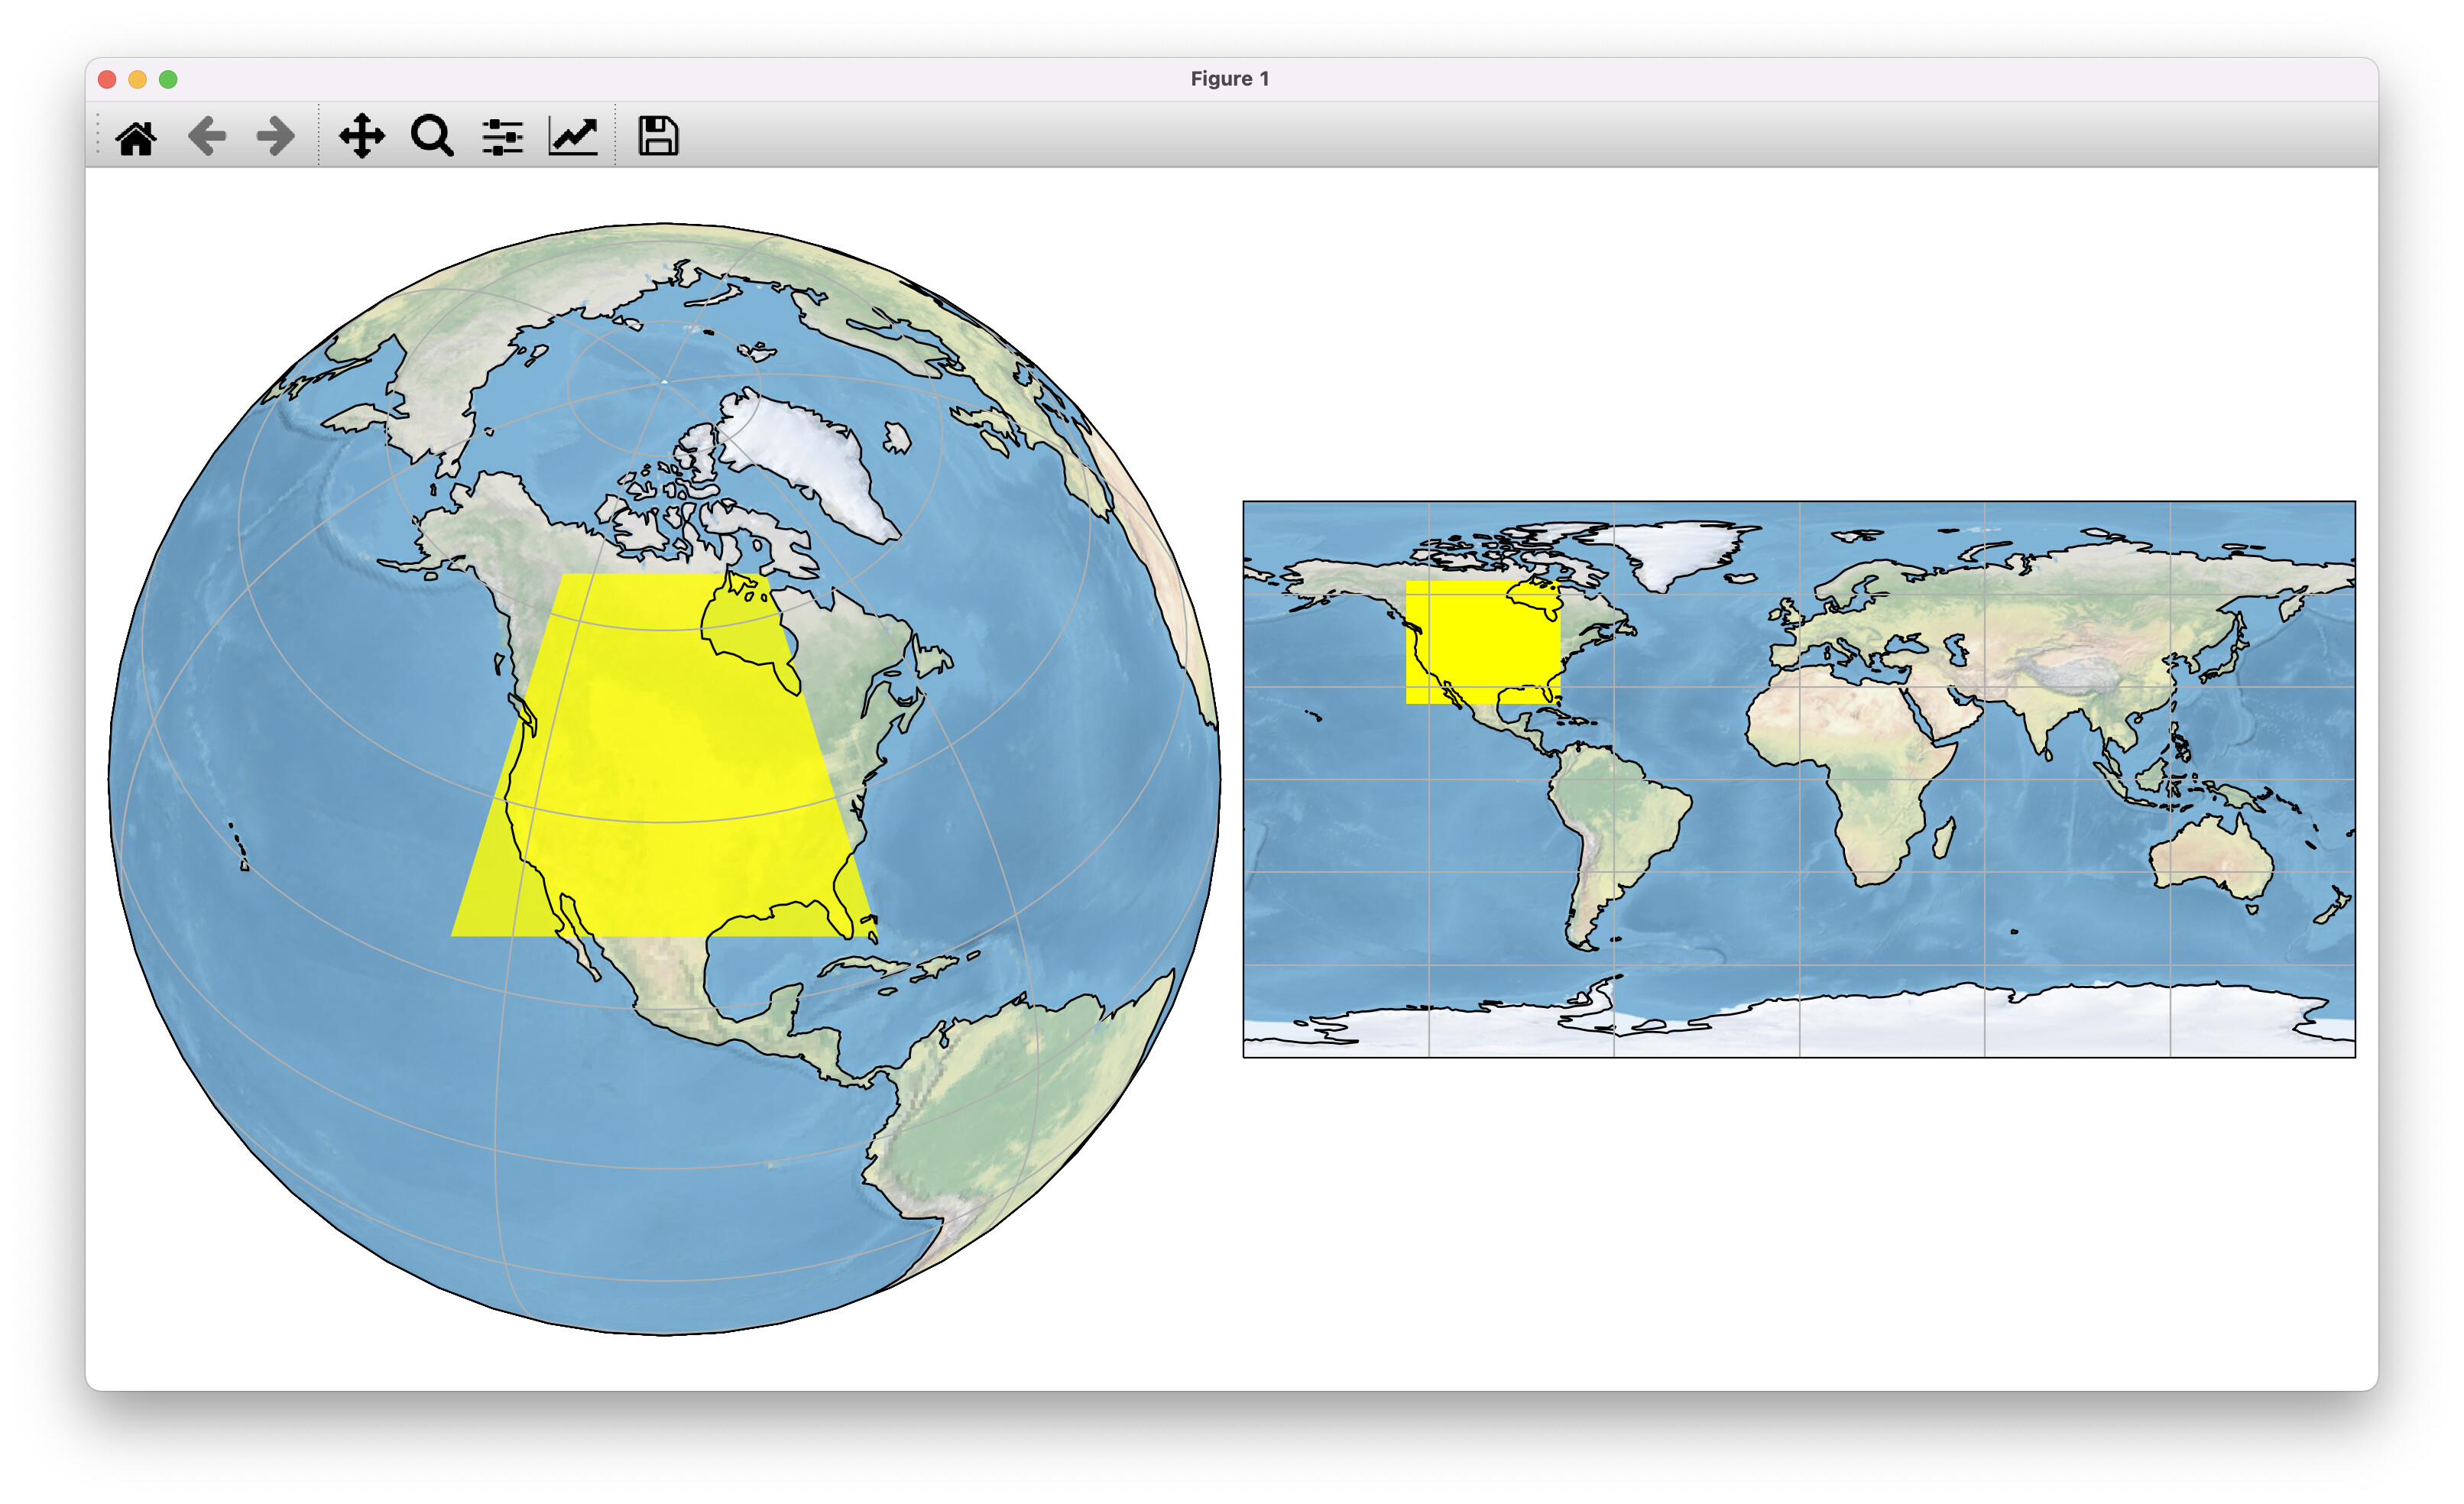
this code has not bugs, I just want to impove its speed. the result is a plot which show a realtime plot for epsg4326 to Orthographic
full code :
import numpy as np
import pandas as pd
import matplotlib
import matplotlib.pyplot as plt

matplotlib.use('Qt5Agg')

import cartopy.crs as ccrs
from shapely import geometry
import geopandas as gpd

import matplotlib.patches as patches


class ProjectionShow(object):
    def __init__(self, box_width=50, box_heigh=40, init_x=40.0, init_y=20.0, move_ccrs=None):
        self.box_width = box_width
        self.box_height = box_heigh
        self.init_x = init_x
        self.init_y = init_y
        self.move_ccrs = move_ccrs
        # self.show_ccrs = show_ccrs

    def gen_init_2d(self):
        """
        生成最原始的数据
        """
        data = np.array([(self.init_x, self.init_y),
                         (self.init_x + self.box_width, self.init_y),
                         (self.init_x + self.box_width, self.init_y + self.box_height),
                         (self.init_x, self.init_y + self.box_height),
                         ])

        return data

    @staticmethod
    def GeoSeries2Numpy(gs):
        """
        将GeoSeries
        geoseries to numpy Nx2
        """
        x, y = gs[0].exterior.xy
        x = np.array(x)
        y = np.array(y)
        data = np.vstack([x, y]).T
        return data

    @staticmethod
    def Numpy2GeoSeries(data, crs=None):
        """
        将向量转换为GeoSeries
        """
        poly = geometry.Polygon(data)
        poly_gpd = gpd.GeoSeries(poly).set_crs('EPSG:4326')
        if crs is None:
            return poly_gpd
        else:
            poly_gpd = poly_gpd.to_crs(crs.proj4_init)
            return poly_gpd

    def GeoSeries_center(self, gs):
        """
        get central_longitude, central_latitude from GeoSeries
        """
        central_longitude, central_latitude = gs.centroid.x[0], gs.centroid.y[0]
        return central_longitude, central_latitude

    def gennewccrs(self, data):
        """
        主要是重新计算新的ccrs,这个data是一个二维向量,-180 ~ 180 -90~90
        返回的是一个新的ccrs
        """
        gs = self.Numpy2GeoSeries(data=data, crs=None)
        central_longitude, central_latitude = self.GeoSeries_center(gs)
        return ccrs.Orthographic(central_longitude=central_longitude,
                                 central_latitude=central_latitude)

    def run(self, data=None):
        if data is None:
            data = self.gen_init_2d()
        self.temp_ccrs = self.gennewccrs(data)

    @property
    def show_ccrs(self):

        return self.temp_ccrs
        # return self.temp_ccrs

    def show_rect(self, data=None):
        if data is None:
            data = self.gen_init_2d()

        gpd_data = self.Numpy2GeoSeries(data, crs=self.temp_ccrs)

        data = self.GeoSeries2Numpy(gpd_data)

        return patches.Polygon(xy=data, fc='yellow')

    def move_rect(self, data=None):
        if data is None:
            data = self.gen_init_2d()
        return patches.Polygon(xy=data, fc='yellow')


class EventHandler:
    def __init__(self):
        fig.canvas.mpl_connect('button_press_event', self.on_press)
        fig.canvas.mpl_connect('button_release_event', self.on_release)
        fig.canvas.mpl_connect('motion_notify_event', self.on_move)
        self.move_xy = move_polygon_part.get_xy()
        self.pressevent = None

    def on_press(self, event):
        print(event)
        if event.inaxes != ax_1:
            return

        if not move_polygon_part.contains(event)[0]:
            return

        self.pressevent = event

    def on_release(self, event):
        self.pressevent = None
        self.move_xy = move_polygon_part.get_xy()

    def on_move(self, event):
        if self.pressevent is None or event.inaxes != self.pressevent.inaxes:
            return

        dx = event.xdata - self.pressevent.xdata
        dy = event.ydata - self.pressevent.ydata

        data = self.move_xy.copy()
        data[:, 0] = data[:, 0] + dx
        data[:, 1] = data[:, 1] + dy

        move_polygon_part.set_xy(data)
        fig.canvas.draw()

        # 绘制左边图

        # show_Polygon_part.set_xy(datatrans(data))

        show_mean = data.mean(axis=0)
        # 更新ax
        show_crs_ = ccrs.Orthographic(central_longitude=show_mean[0],
                                      central_latitude=show_mean[1])
        # show_poly_gpd = poly_gpd.to_crs(show_crs_.proj4_init)
        global ax_0
        # ax_0.update({'projection':show_crs_})
        ax_0.cla()

        new_show_crs = proection_show.gennewccrs(data=data)

        ax_0 = fig.add_subplot(121, projection=new_show_crs)
        # ax_0.stock_img()
        ax_0.background_img()

        show_Polygon_ = patches.Polygon(
            xy=proection_show.GeoSeries2Numpy(proection_show.Numpy2GeoSeries(data=data, crs=new_show_crs)), fc='yellow',
            alpha=0.8)
        _ = ax_0.add_patch(show_Polygon_)
        ax_0.coastlines(resolution='110m')
        ax_0.gridlines(
        )

        fig.canvas.draw_idle()

        # move_Polygon_part.set_xy(np.vs)


if __name__ == '__main__':
    # 创建两个ccrs

    move_ccrs = ccrs.PlateCarree()

    # 初始化
    proection_show = ProjectionShow()
    proection_show.run()

    show_ccrs = proection_show.show_ccrs

    # 创建一个面板

    fig = plt.figure(figsize=(15, 8))

    ax_0 = fig.add_subplot(121, projection=show_ccrs)
    ax_1 = fig.add_subplot(122, projection=move_ccrs)

    ax_0.stock_img()
    ax_0.coastlines(resolution='110m')
    ax_0.gridlines()

    ax_1.stock_img()
    ax_1.coastlines(resolution='110m')
    ax_1.gridlines()

    move_polygon_part = ax_1.add_patch(proection_show.move_rect())
    show_polygon_part = ax_0.add_patch(proection_show.show_rect())

    handler = EventHandler()
    plt.tight_layout()
    plt.show()