In this code I have tried to use fill_between to be able to plot the mean and standard deviation differently but for some reason this doesn’t happen.
import numpy as np
X = np.random.rand(20,1) * 10 -5
y = np.sin(X)
X.shape,y.shape
((20, 1), (20, 1))
from keras.models import Sequential
from keras.layers import Dense, Dropout, Activation
import keras.backend as K
K.clear_session()
K.set_learning_phase(1)
model = Sequential()
model.add(Dense(1,input_dim = 1))
model.add(Dropout(0.05))
model.add(Dense(20))
model.add(Activation('relu'))
model.add(Dropout(0.05))
model.add(Dense(20))
model.add(Activation('relu'))
model.add(Dropout(0.05))
model.add(Dense(20))
model.add(Activation('sigmoid'))
model.add(Dense(1))
from tensorflow.keras.optimizers import SGD
model.compile(loss='mse',optimizer=SGD(lr=0.01))
model.fit(X,y,epochs=10000,batch_size=10,verbose=0)
X_test = np.arange(-10,10,0.1)
X_test = np.expand_dims(X_test,-1)
probs = []
for i in range(100):
    out = model.predict(X_test)
    probs.append(out)
p = np.array(probs)
mean = np.mean(p,axis=0)
std = np.std(p,axis=0)
p.shape


import matplotlib.pyplot as plt
plt.figure(figsize=(10,7))
plt.plot(X_test,mean,c='blue')

lower_bound = mean - std * 0.5
upper_bound =  mean + std * 0.5
plt.fill_between(X_test.flatten(),upper_bound.flatten(),lower_bound.flatten(),alpha=0.25, facecolor='blue')

lower_bound = mean - std
upper_bound =  mean + std
plt.fill_between(X_test.flatten(),upper_bound.flatten(),lower_bound.flatten(),alpha=0.25, facecolor='blue')

lower_bound = mean - std * 2
upper_bound =  mean + std * 2
plt.fill_between(X_test.flatten(),upper_bound.flatten(),lower_bound.flatten(),alpha=0.25, facecolor='blue')

plt.scatter(X,y,c='black')
The current output:
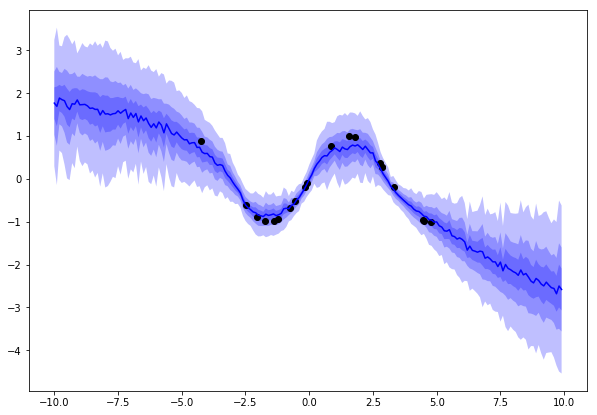
The expected output:
Thank you for moving this here. If you can reproduce this without model that would help us diagnose if there is an issue. Or maybe there are users here who have expertise in keras. Or maybe print out the first 20 values of std…
1 Like
LuchoValr:
import numpy as np
X = np.random.rand(20,1) * 10 -5
y = np.sin(X)
X.shape,y.shape
((20, 1), (20, 1))
X_test = np.arange(-10,10,0.1)
X_test = np.expand_dims(X_test,-1)
probs = []
for i in range(100):
    out = model.predict(X_test)
    probs.append(out)
p = np.array(probs)
mean = np.mean(p,axis=0)
std = np.std(p,axis=0)
p.shape


import matplotlib.pyplot as plt
plt.figure(figsize=(10,7))
plt.plot(X_test,mean,c='blue')

lower_bound = mean - std * 0.5
upper_bound =  mean + std * 0.5
plt.fill_between(X_test.flatten(),upper_bound.flatten(),lower_bound.flatten(),alpha=0.25, facecolor='blue')

lower_bound = mean - std
upper_bound =  mean + std
plt.fill_between(X_test.flatten(),upper_bound.flatten(),lower_bound.flatten(),alpha=0.25, facecolor='blue')

lower_bound = mean - std * 2
upper_bound =  mean + std * 2
plt.fill_between(X_test.flatten(),upper_bound.flatten(),lower_bound.flatten(),alpha=0.25, facecolor='blue')

plt.scatter(X,y,c='black')
import numpy as np
X = np.random.rand(20,1) * 10 -5
y = np.sin(X)
X.shape,y.shape
((20, 1), (20, 1))

X_test = np.arange(-10,10,0.1)
X_test = np.expand_dims(X_test,-1)
probs = []
for i in range(100):
    out = model.predict(X_test)
    probs.append(out)
p = np.array(probs)
mean = np.mean(p,axis=0)
std = np.std(p,axis=0)
p.shape


import matplotlib.pyplot as plt
plt.figure(figsize=(10,7))
plt.plot(X_test,mean,c='blue')

lower_bound = mean - std * 0.5
upper_bound =  mean + std * 0.5
plt.fill_between(X_test.flatten(),upper_bound.flatten(),lower_bound.flatten(),alpha=0.25, facecolor='blue')

lower_bound = mean - std
upper_bound =  mean + std
plt.fill_between(X_test.flatten(),upper_bound.flatten(),lower_bound.flatten(),alpha=0.25, facecolor='blue')

lower_bound = mean - std * 2
upper_bound =  mean + std * 2
plt.fill_between(X_test.flatten(),upper_bound.flatten(),lower_bound.flatten(),alpha=0.25, facecolor='blue')

plt.scatter(X,y,c='black')
print(std[0:20,:])
output
[[4.7683716e-07]
 [2.3841858e-06]
 [2.8610229e-06]
 [2.8610229e-06]
 [9.5367432e-07]
 [1.9073486e-06]
 [1.6689301e-06]
 [1.4305115e-06]
 [1.4305115e-06]
 [1.4305115e-06]
 [1.4305115e-06]
 [1.6689301e-06]
 [2.2649765e-06]
 [7.1525574e-07]
 [0.0000000e+00]
 [1.0728836e-06]
 [1.5497208e-06]
 [8.3446503e-07]
 [8.3446503e-07]
 [8.3446503e-07]]

print(mean[0:20,:])
output
[[2.12196  ]
 [2.1112354]
 [2.1002762]
 [2.089076 ]
 [2.077625 ]
 [2.0659225]
 [2.053959 ]
 [2.0417283]
 [2.029216 ]
 [2.0164175]
 [2.0033224]
 [1.9899187]
 [1.9762067]
 [1.962162 ]
 [1.9477844]
 [1.9330593]
 [1.9179698]
 [1.9025117]
 [1.8866681]
 [1.8704227]]
jklymak
January 22, 2023, 10:29pm
5
Your code above doesn’t execute because model is not defined. However, std is 1e-6 whereas your data runs from 1.8 to 2.1, so you are not going to be able to see the fill between because it is so small relative to the data.