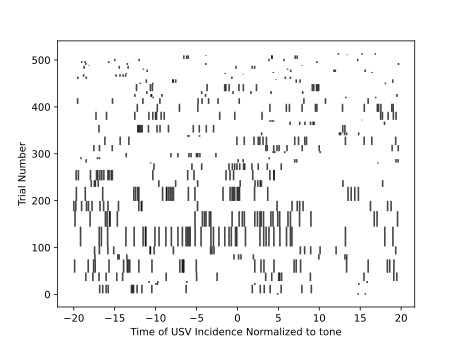
So I have a script that creates multiple rows of lines in an eventplot. As far as the data is concerned everything seems to be plotting correctly. The problem is of course that the lines are not of equivalent length. I want all of them to be one length or one x value. This eventplot is plotting trial data so I want each x value to be a plot of the incidence of what I’m measuring in each trial.
Here is the output:
It would help to see the associated code. - Cameron
#%%imports and setup for initial data
import matplotlib.pyplot as plt
import numpy as np
import tkinter as tk
from tkinter import *
from tkinter import filedialog
import pandas as pds
from tqdm import tqdm as tq
from pathlib import Path
import numpy as np

#%%Create Button Function for data input
def get_file_path():
    global file_path
    # Open and return file path
    file_path= filedialog.askopenfilename(title = "Select A File", filetypes = (("Excel Files", "*.xlsx"),))
    l1 = Label(window, text = "File path: " + file_path).pack()

window = Tk()
width = window.winfo_screenwidth()
height = window.winfo_screenheight()

def close():
    window.destroy()

# Creating a button to search the file
b1 = Button(window, text = "Open File", command = get_file_path).pack()
b2 = Button(window, text = "OK", command = close).pack()
window.geometry("%dx%d" % (width, height))
window.mainloop()
print(file_path)

#%%Read Excel File
ds = pds.read_excel(io = file_path, usecols = "A,D", skiprows = 1, keep_default_na = False)
#%%usv incident beggining times in seconds
usvTimes = ds["Begin Time (s)"].tolist()
#beginning times for tones in seconds
toneStart = ds["Tone Time Markers"].tolist()
toneStart2 = ds["Tone Time Markers"].tolist()
#%%creates empty lists to be used by loops later
graphStart = []
graphEnd = [ ]

#%%creates the first parameter of the x value for each graph
print("Calculating GraphStart")
for num in tq(toneStart):
    try:
        int(float(num))
    except:
        pass
    else:
        graphStart.append(num - 10)
print("Complete")

#%%creates the second parameter of the x value for each graph
print("Calculating GraphEnd")
for num in tq(toneStart2):
    try:
        int(float(num))
    except:
        pass
    else:
        graphEnd.append(num + 10)
print("Complete")

#%%Makes usvTimes usable
print("Calculating USVTimeStamps")
for num in tq(usvTimes):
    try:
        int(float(num))
    except:
        pass
print("Complete")

#%%pair beggining and end parameter into a full list
graphpair = zip(graphStart,graphEnd)

#%%Zip x and y coordinates together
graphx = list(graphpair)
#%%create graphs
print("Input File Name:")
filename = str(input())
print("Creating Graphs")
myPath = str(Path.home() / "Downloads")
print(myPath)

lists = []
for index, num in tq(enumerate(graphx)):
    x,y = num
    leftbound = (x - x) - 30
    rightbound = y - x
    za = x - 20
    zb = x + 20
    sublist = []
    for i in usvTimes:
        try:
            x + 0
        except:
            pass
        if i == 0:
            continue
        elif za <= i <= zb:
            sublist.append(i-x)
        else:
            continue
        lists.append(sublist)
np.array(lists , dtype=object)
data = lists
plt.eventplot(data , colors='black' , lineoffsets=1 , linelengths=1)
plt.ylabel("Trial Number")
plt.xlabel("Time of USV Incidence Normalized to tone")
plt.savefig(myPath + "/Eventplot" + filename + ".pdf")
plt.show()
print("Graphs Complete")
Hmm looks like maybe I responded to myself instead of you. I posted my code. Thanks for your help.
Please give a minimal self-contained example that shows the problem. It’s hard to know where the issue is here.
If I provided a specific excel file I used would that help? Let me know how I can be more specific to make it clearer. Thanks!
Ideally it would be minimal; usually you will find the problem on your own, or have a much more focused question to ask: http://sscce.org
It would also help if you were to explain what you think is wrong in the above. Its not clear what you think is not the right length.
1 Like
Two things in this post:
- a request for @Desto2014 to provide data details below
- a transcript of the code with formatting preserved
Because @Desto2014’s code isn’t inside code fences the indentation and
some punctuation is lost (on the web forum). Since I’ve got the email
copy, I’ll repost the code below. @Desto2014, to preserve formatting,
post code and other output (eg tracebacks) inside triple backticks:
 ```
 your code
 goes here
 ```
In terms of reproduction, the code ends:
 np.array(lists , dtype=object)
 data = lists
 plt.eventplot(data , colors='black' , lineoffsets=1 , linelengths=1)
 plt.ylabel("Trial Number")
 plt.xlabel("Time of USV Incidence Normalized to tone")
 plt.savefig(myPath + "/Eventplot" + filename + ".pdf")
 plt.show()
 print("Graphs Complete")
Can you dump the vaue of lists into a CSV file before the plt.*
calls? Or just print it to a text file?
In fact, the plot looks like it does not have all that much data; you
could print(lists) and copy/paste that into a reply post here.
With that information we could just make a tiny programme which goes:
 lists = [...... your data .....]
 np.array(lists , dtype=object)
 data = lists
 plt.eventplot(data , colors='black' , lineoffsets=1 , linelengths=1)
 plt.ylabel("Trial Number")
 plt.xlabel("Time of USV Incidence Normalized to tone")
 plt.savefig(myPath + "/Eventplot" + filename + ".pdf")
 plt.show()
 print("Graphs Complete")
BTW, I do not think the line:
np.array(lists , dtype=object)
is doing anything for you - you’re not assigning it to anything.
The code, indenting preserved:
 #%%imports and setup for initial data
 import matplotlib.pyplot as plt
 import numpy as np
 import tkinter as tk
 from tkinter import *
 from tkinter import filedialog
 import pandas as pds
 from tqdm import tqdm as tq
 from pathlib import Path
 import numpy as np

 #%%Create Button Function for data input
 def get_file_path():
     global file_path
     # Open and return file path
     file_path= filedialog.askopenfilename(title = "Select A File", filetypes = (("Excel Files", "*.xlsx"),))
     l1 = Label(window, text = "File path: " + file_path).pack()

 window = Tk()
 width = window.winfo_screenwidth()
 height = window.winfo_screenheight()

 def close():
     window.destroy()

 # Creating a button to search the file
 b1 = Button(window, text = "Open File", command = get_file_path).pack()
 b2 = Button(window, text = "OK", command = close).pack()
 window.geometry("%dx%d" % (width, height))
 window.mainloop()
 print(file_path)

 #%%Read Excel File
 ds = pds.read_excel(io = file_path, usecols = "A,D", skiprows = 1, keep_default_na = False)
 #%%usv incident beggining times in seconds
 usvTimes = ds["Begin Time (s)"].tolist()
 #beginning times for tones in seconds
 toneStart = ds["Tone Time Markers"].tolist()
 toneStart2 = ds["Tone Time Markers"].tolist()
 #%%creates empty lists to be used by loops later
 graphStart = []
 graphEnd = [ ]

 #%%creates the first parameter of the x value for each graph
 print("Calculating GraphStart")
 for num in tq(toneStart):
     try:
         int(float(num))
     except:
         pass
     else:
         graphStart.append(num - 10)
 print("Complete")

 #%%creates the second parameter of the x value for each graph
 print("Calculating GraphEnd")
 for num in tq(toneStart2):
     try:
         int(float(num))
     except:
         pass
     else:
         graphEnd.append(num + 10)
 print("Complete")

 #%%Makes usvTimes usable
 print("Calculating USVTimeStamps")
 for num in tq(usvTimes):
     try:
         int(float(num))
     except:
         pass
 print("Complete")

 #%%pair beggining and end parameter into a full list
 graphpair = zip(graphStart,graphEnd)

 #%%Zip x and y coordinates together
 graphx = list(graphpair)
 #%%create graphs
 print("Input File Name:")
 filename = str(input())
 print("Creating Graphs")
 myPath = str(Path.home() / "Downloads")
 print(myPath)

 lists = []
 for index, num in tq(enumerate(graphx)):
     x,y = num
     leftbound = (x - x) - 30
     rightbound = y - x
     za = x - 20
     zb = x + 20
     sublist = []
     for i in usvTimes:
         try:
             x + 0
         except:
             pass
         if i == 0:
             continue
         elif za <= i <= zb:
             sublist.append(i-x)
         else:
             continue
         lists.append(sublist)
 np.array(lists , dtype=object)
 data = lists
 plt.eventplot(data , colors='black' , lineoffsets=1 , linelengths=1)
 plt.ylabel("Trial Number")
 plt.xlabel("Time of USV Incidence Normalized to tone")
 plt.savefig(myPath + "/Eventplot" + filename + ".pdf")
 plt.show()
 print("Graphs Complete")
Cheers,
Cameron Simpson cs@cskk.id.au
Ok. What I think is wrong is that I’ve set the line length to be 1. So every single line should be of the length one globally. I’m not understanding why each line has a different length. Each axis of the array is plotting with the same length but each axis has a different line length despite having put in the parameter “line-length = 1” Perhaps I’m simply not understanding what the linelengths argument actually does? Is it an interaction between line length and line offset that is the issue? Apologies if this isn’t very helpful. I’m only a few months into coding so asking questions is a bit of a challenge for me.
Hi, thank you for your help. Apologies for being so green at posting to forums. Using the pandas Dataframe to csv function here is the file that I get for lists: CSV File
I don’t think you can upload CSV files so I added a drive link. Hopefully that is allowed.
We’re all green at some point. - Cameron
···
On 10Oct2022 21:43, Desto2014 via Matplotlib nobody@discourse.matplotlib.org wrote:
Apologies for being so green at posting to forums.
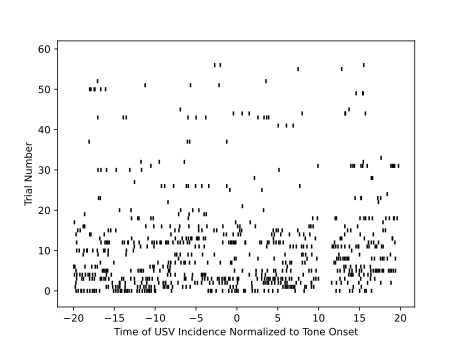
Issue Solved: My sublists were appending extra times. Changed where it was hierarchically and it fixed my script.
Glad to hear this. I got distracted.
Can you post an example plot looking the way your wanted, because that
wasn’t totally clear to us.
Thanks,
Cameron Simpson cs@cskk.id.au
···
On 15Oct2022 17:11, Desto2014 via Matplotlib nobody@discourse.matplotlib.org wrote:
Issue Solved: My sublists were appending extra times. Changed where it
was hierarchically and it fixed my script.
Yep!
1 Like
Thank you! - Cameron