Are there guidelines for what makes a good example to be included with the matplotlib examples?
I have a matplotlib snippet I'd like to post somewhere, but I'm not sure where to put it. I doubt it'd be useful enough to be included with the packaged examples. I was thinking about putting it in the matplotlib examples in the Scipy cookbook, but I wasn't sure how active the site is.
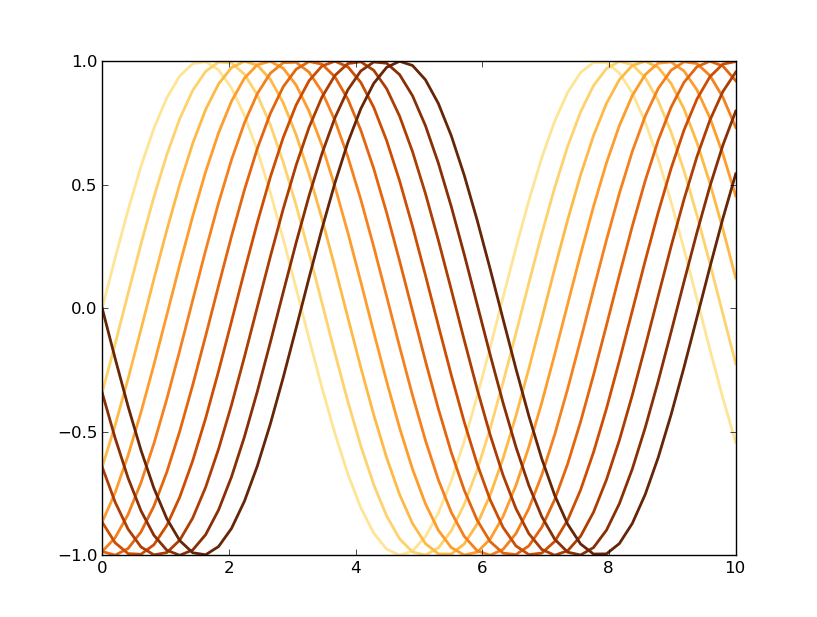
In any case, the code I'd like to post changes the color cycle to use successive colors from a colormap. I find this really useful for plotting curves that evolve in time on the same plot. I've attached an image illustrating this idea. The code is pretty simple and is also attached.
-Tony
color_cycle.py (2.88 KB)
I'm happy to post this example in the examples dir, where it will
automatically get picked up in the website gallery and examples dir.
The scipy cookbook is fine too, but I would prefer that a little mini
tutorial be written in rest explaining the example and we can start a
cookbook in the mpl docs. If you would like to go this route, we can
add a section to the users guide for "explained examples", aka a
cookbook.
I am curious though why you prefer to alter the default color cycle
rather than just passing the color in to the plot command -- it seems
more explicit to pass the color in directly rather than rely on the
default cycle.
JDH
···
On Fri, Jun 5, 2009 at 11:39 PM, Tony S Yu<tonyyu@...1166...> wrote:
Are there guidelines for what makes a good example to be included with the
matplotlib examples?
I have a matplotlib snippet I'd like to post somewhere, but I'm not sure
where to put it. I doubt it'd be useful enough to be included with the
packaged examples. I was thinking about putting it in the matplotlib
examples in the Scipy cookbook, but I wasn't sure how active the site is.
In any case, the code I'd like to post changes the color cycle to use
successive colors from a colormap. I find this really useful for plotting
curves that evolve in time on the same plot. I've attached an image
illustrating this idea. The code is pretty simple and is also attached.
I'm happy to post this example in the examples dir, where it will
automatically get picked up in the website gallery and examples dir.
That'd be great!
The scipy cookbook is fine too, but I would prefer that a little mini
tutorial be written in rest explaining the example and we can start a
cookbook in the mpl docs. If you would like to go this route, we can
add a section to the users guide for "explained examples", aka a
cookbook.
Now that I think about it, maybe this example isn't suited for a cookbook. Or maybe I'm just being lazy and avoiding the work involved in writing an explanation. 
I am curious though why you prefer to alter the default color cycle
rather than just passing the color in to the plot command -- it seems
more explicit to pass the color in directly rather than rely on the
default cycle.
JDH
Actually, I originally cycled through colors in my plot loop, which I agree is more explicit. However, I got tired of the extra code involved with this method and went looking for a way to change the defaults. Plus, I already have of a module of functions I use to change matplotlib defaults (different fontsizes, linewidths, etc. for publications, presentations, etc), and this function fit quite nicely with that module.
-Tony
PS. If it'd be useful to show different ways of cycling through colors, here's another version of my example:
color_gradient_cycle.py (3.91 KB)
···
On Jun 6, 2009, at 9:34 AM, John Hunter wrote:
I am curious though why you prefer to alter the default color cycle
rather than just passing the color in to the plot command
[...]
I got tired of the extra code involved with this method and went looking for a way to change the defaults.
I do something similar to enforce style/substance separation; the plotting is the simplest possible line at the end of the data analysis, and all the stylistic choices are somewhere else. Makes it easy to keep all plot styles consistent during a project, and makes it slightly harder to futz with font prettiness when I should be doing real work.
Chloe Lewis
Graduate student, Amundson Lab
Division of Ecosystem Sciences, ESPM
University of California, Berkeley
137 Mulford Hall - #3114
Berkeley, CA 94720-3114
chlewis@...2456...