Hello,
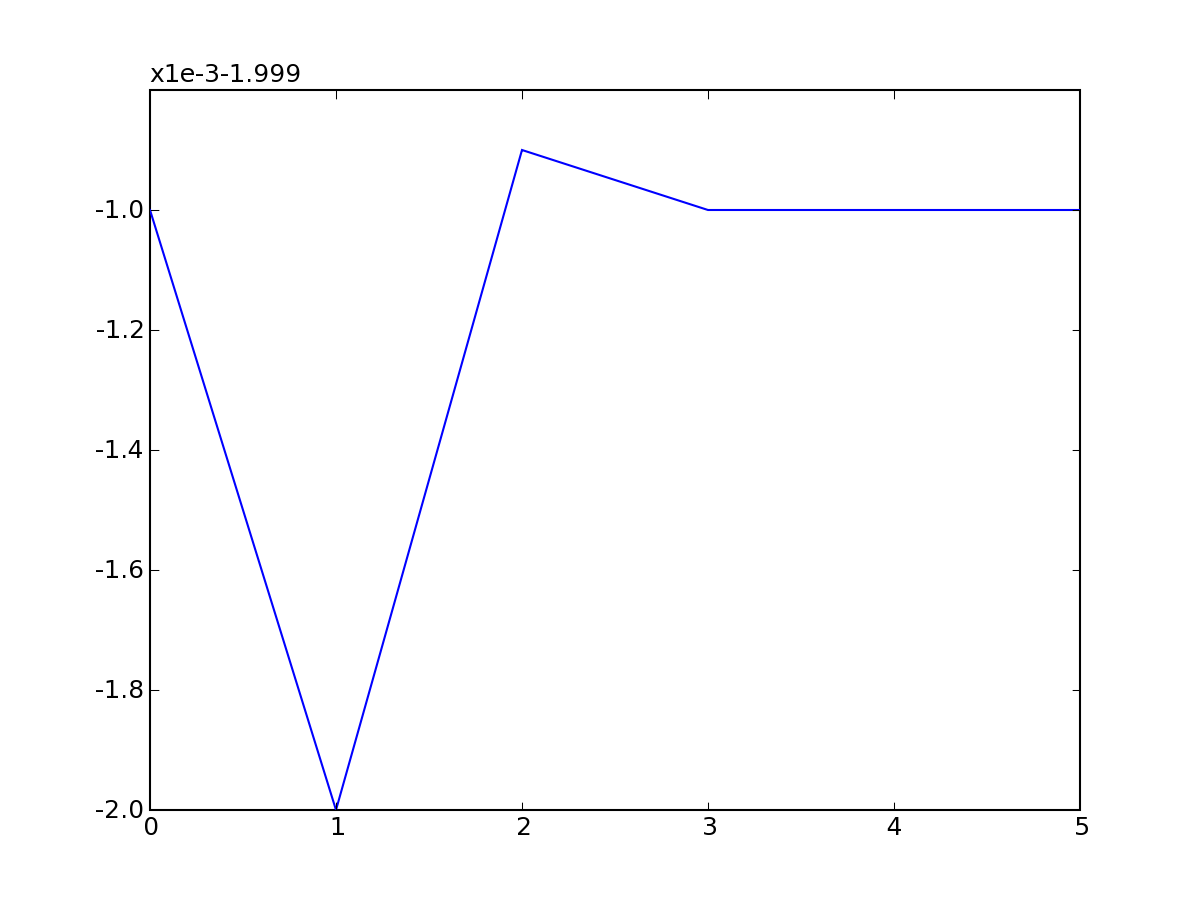
When mpl plots equal values, it produces a line as expected. But if the values are equal C +/- epson, with epson <= 0.001 where C is a constant then the vertical range is presented as (for example) x1e-3-1.999 which is not at all clear. Here's an example (png attached):
#! /usr/bin/python
from pylab import *
x = [0.0,1.0,2.0,3.0,4.0,5.0]
y= [-2.0,-2.001,-1.9999,-2.0,-2.0,-2.0]
plot(x,y)
show()
Is there a way to limit the maximum default zoom? Although the example uses pylab I'm really using mpl OO interface (on a linux machine).
Thanks,
Jo�o Lu�s Silva