I am working on a project where I display a full world map of the Foxhole game. The developers provide through their API the requirements to build a Voronoi diagram.
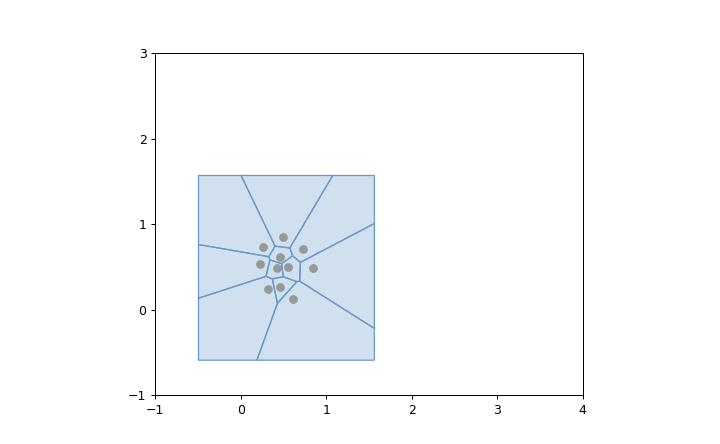
Through their API they provide coordinates like the following:
"x" : 0.49129963
"y" : 0.8499718
They also provide raw files like the following to draw the Voronoi diagrams on top of:
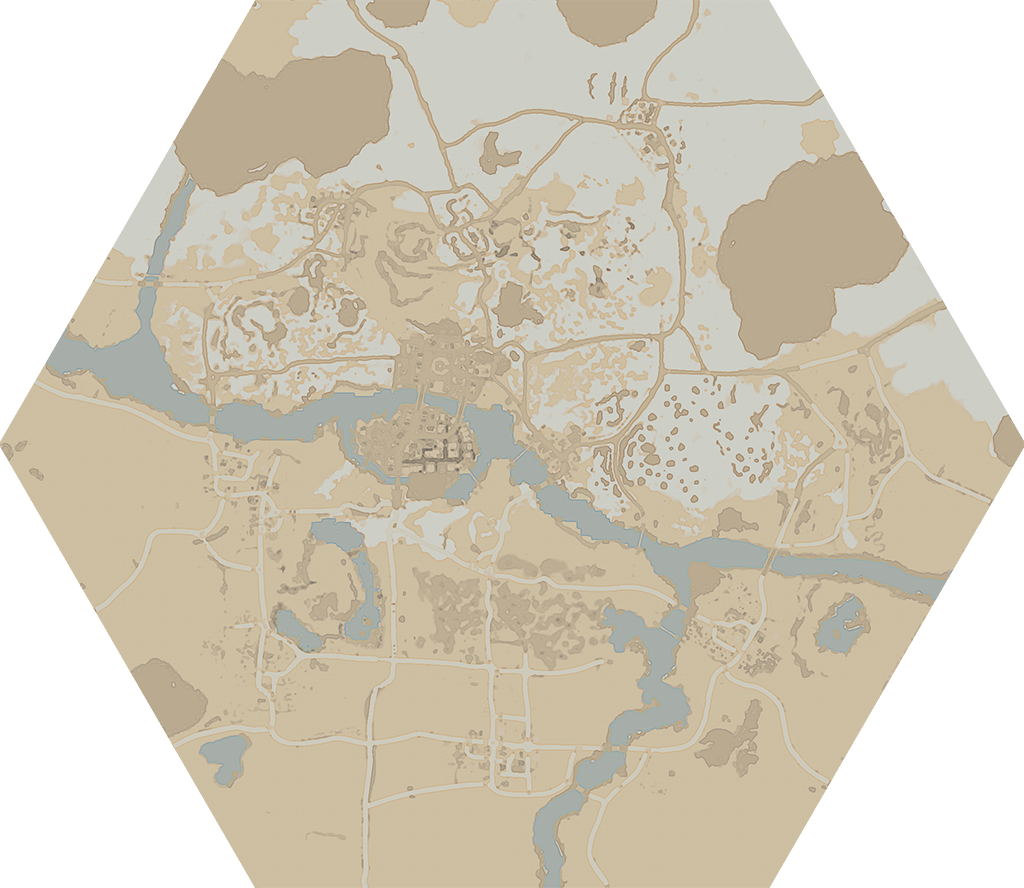
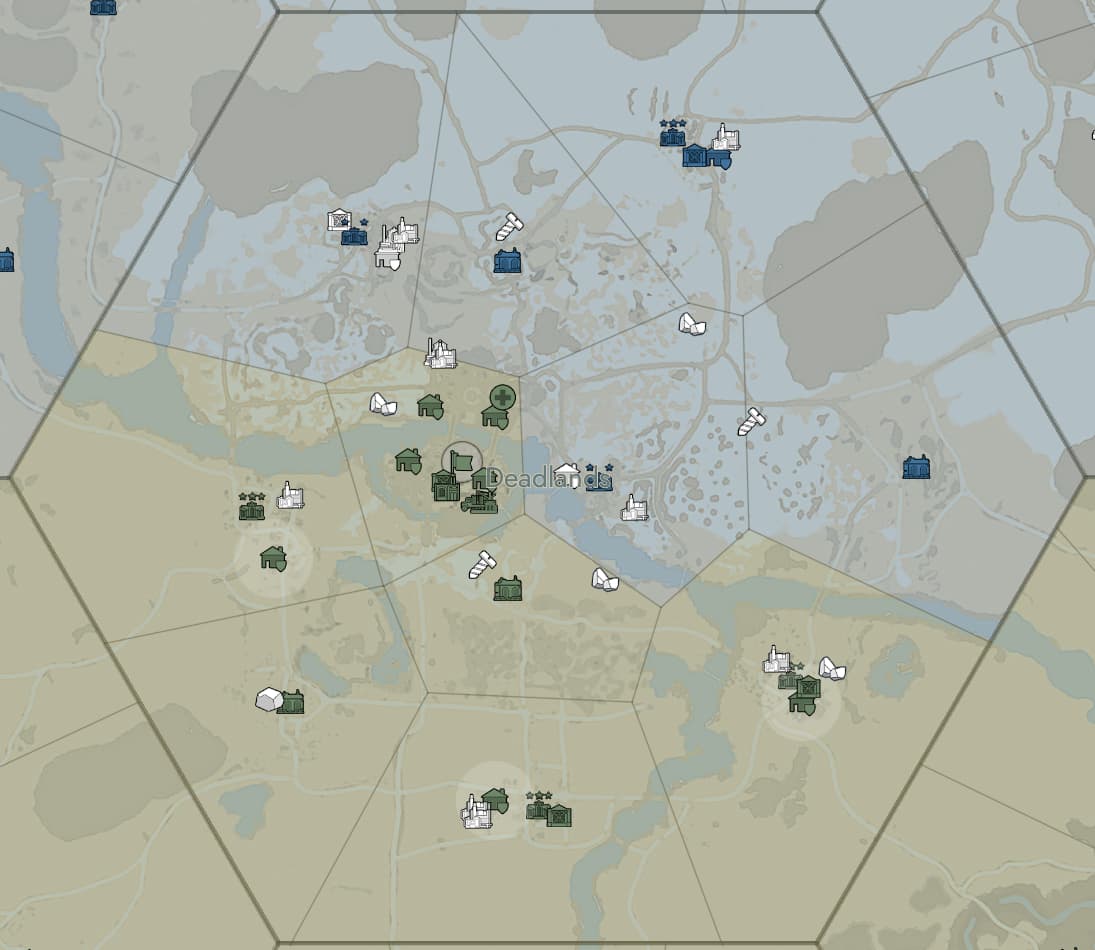
The end result would be something similar to the following with a bounding hexagon to contain the spread of the cells.
I’ve tried multiple python libraries with varying successes but unfortunately the majority of them suffer from code rot or were built for very specific implementations.
Can matplotlib achieve something like this? I am thinking that at the least I could provide the appropriate Voronoi library a hexagon combined with the coordinates and get a list of polygons to draw?