I have encountered a behaviour whilst using legend in matplotlib that looks to me like it should not necessarily be the default one. The code below reproduces the behaviour:
import matplotlib.pyplot as plt

fig, ax = plt.subplots()
for i, label in enumerate(["A", "B\nC", "D\nE\nF"]):
    plt.plot([i, i + 1], [i, 2 * i], label=label)
ax.legend(ncol=2, loc="lower right")
plt.show()
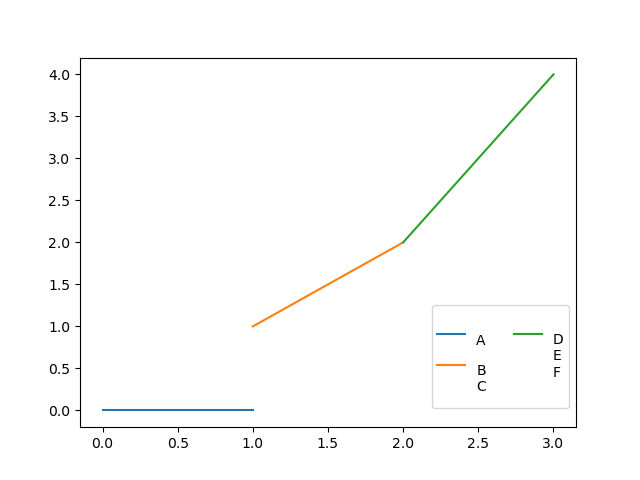
As you can see in the following figure
there is what I would call too much white space in the legend. This is because the third handle is perfectly aligned vertically with the first one, despite the difference in the vertical span of the associated texts. Should that be the default behaviour? And regardless of the answer to the previous question, is there a way to change the vertical alignment of the third handle and text?
I found this solution with the help of this SO post :
fig, ax = plt.subplots()

for i, label in enumerate(["A", "B\nC", "D\nE\nF"]):
    plt.plot([i, i + 1], [i, 2 * i], label=label)

leg = ax.legend(ncol=2,
                bbox_to_anchor=(0.5, -0.15, 0.5, 0.5),
                #frameon=False,
               )

for t in leg.get_texts():
    t.set_verticalalignment("center_baseline")

# next line is optional if you uncomment the `frameon` arg of the legend
leg._legend_box.set_height(leg.get_bbox_to_anchor().height*.5)

plt.savefig("fig_framed.png")
plt.show();
Thanks for your suggestion. Given the exact problem at hand, this is probably close to the best possible outcome without changing the handles’ alignment. Nevertheless, I would really be interested in a way to actually move that green line handle downwards. I will have another try at it, but I am not too hopeful: I am not familiar enough with Matplotlib internals to really know what I am looking for.
EDIT
So I was a bit more successful than I thought I would be. I now have the following code:
import matplotlib.pyplot as plt
fig, ax = plt.subplots()
for i, label in enumerate(["A", "B\nC", "D\nE\nF"]):
plt.plot([i, i + 1], [i, 2 * i], label=label)
leg = ax.legend(ncol=2, loc="lower right")
leg.legend_handles[0].set_ydata([11] * 3)
leg.legend_handles[1].set_ydata([11] * 3)
leg.legend_handles[2].set_ydata([-1] * 3)
leg.texts[0].set_y(10)
leg.texts[1].set_y(9)
leg.texts[2].set_y(-7)
leg._legend_box.set_height(60)
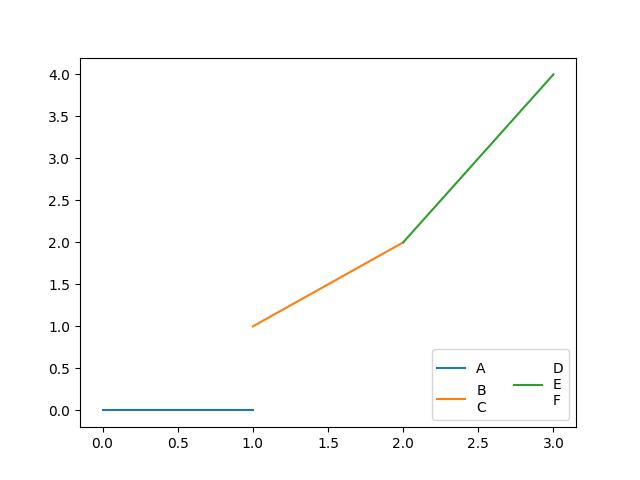
plt.show()
The result matches what I would like. However, having everything hard coded is not optimal, and I wonder if there is a way to determine values given to set_ydata, set_y, and set_height.