I have been trying to use the plot_date of matplotlib (0.6.2.4) with limited success.
Apparently, I must have some basic misconception as to what is going on.
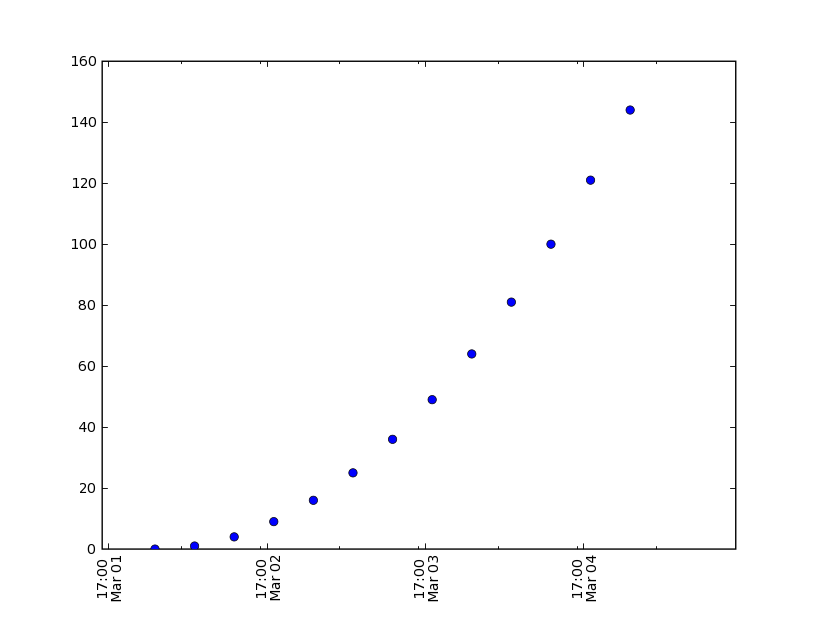
What I am try to do is plot data that has values every 6 hours with major ticks at each day and minor every 12 hours.
Attached is my latest attempt. The basic problem is that the major and minor ticks do not line up.
Thanks for any help. code and plot are below
Jim
import matplotlib
matplotlib.use('TkAgg')
from matplotlib import matlab
ML = matlab
from matplotlib.ticker import YearLocator, MonthLocator, DateFormatter, DayLocator,HourLocator
import datetime
from matplotlib.dates import PyDatetimeConverter
majorTick = DayLocator(1)
minorTick = HourLocator(12)
pydates = PyDatetimeConverter()
date1 = datetime.datetime( 2000, 3, 2, 00)
date2 = datetime.datetime( 2000, 3, 5, 00)
delta = datetime.timedelta(hours=6)
dates =
d = date1
while d <= date2:
dates.append(d)
d = d + delta
y = ML.arrayrange( len(dates)*1.0)
ysq = y*y
ax = ML.subplot(111)
ML.plot_date(dates, ysq, pydates)
ax.xaxis.set_major_locator(majorTick)
ML.set(ax,xlim = (pydates(dates[0]), pydates(dates[-1])))
ax.xaxis.set_minor_locator(minorTick)
ax.autoscale_view()
labels = ax.get_xticklabels()
ML.set(labels, 'rotation', 90)