Hi all,
I’m trying to use AnchoredSizeBar to draw a scale bar just outside the axes, for readability and so it doesn’t overlap with data. Also to make it extra complicated I want to draw a vertical scale bar as well.
Here’s a screenshot from a collaborator’s figure just in case it’s not clear:
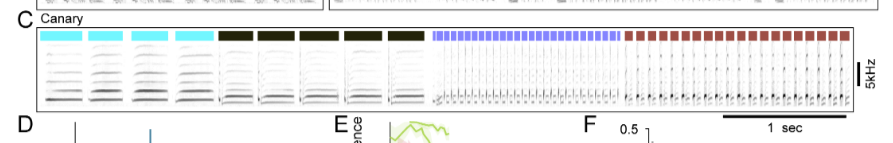
What I want is to add something like the “1 sec” and “5kHz” scale bars
They used Illustrator but I am determined to have my figures totally reproducible and do it all with matplotlib ![]()
I feel like it’s pretty common to want scale bars like this, at least in my field of neuro. I found one implementation that almost does what I want.
And others have raised issues on the matplotlib-scalebar repo asking about similar capability:
Looks like there’s a PR in progress (removed link since new users can only post 2 links, but it’s linked by GitHub on that issue)
But the main issue I’m having is getting the scale bar to plot outside the axes.
My naive solution would be to include a bbox_to_anchor argument but when I do that the scale bar just disappears.
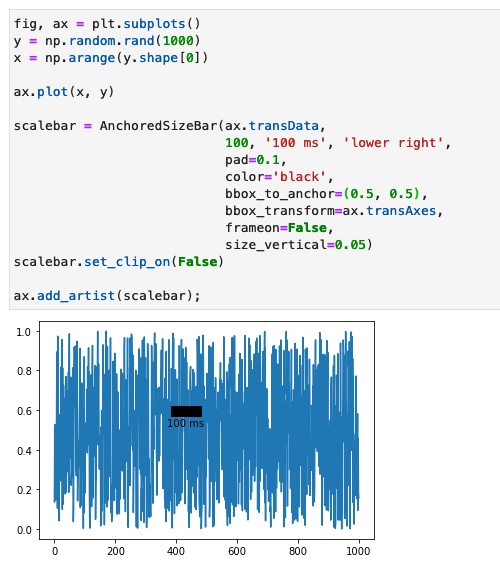
Here’s a minimal reproducible example:
fig, ax = plt.subplots()
y = np.random.rand(1000)
x = np.arange(y.shape[0])

ax.plot(x, y)

scalebar = AnchoredSizeBar(ax.transData,
                           100, '100 ms', 'lower right',
                           pad=0.1,
                           color='black',
                           # bbox_to_anchor=(0.9,-0.1),
                           frameon=False,
                           size_vertical=0.05)
ax.add_artist(scalebar);
gives me a plot with a scale bar (removed images since new users can only post one)
but uncommenting the bbox_to_anchor argument
fig, ax = plt.subplots()
y = np.random.rand(1000)
x = np.arange(y.shape[0])

ax.plot(x, y)

scalebar = AnchoredSizeBar(ax.transData,
                           100, '100 ms', 'lower right',
                           pad=0.1,
                           color='black',
                           bbox_to_anchor=(0.9,-0.1),
                           frameon=False,
                           size_vertical=0.05)
ax.add_artist(scalebar);
gives me a plot with no scale bar
So my question is:
Will bbox_to_anchor work this way with AnchoredSizeBar or do I need to find some other solution?
Maybe the quick-and-dirty solution is just to add rectangles + text objects outside the axes?
Thank you!