I am trying to create a plot with a diverging colour map which is not symmetric around zero.
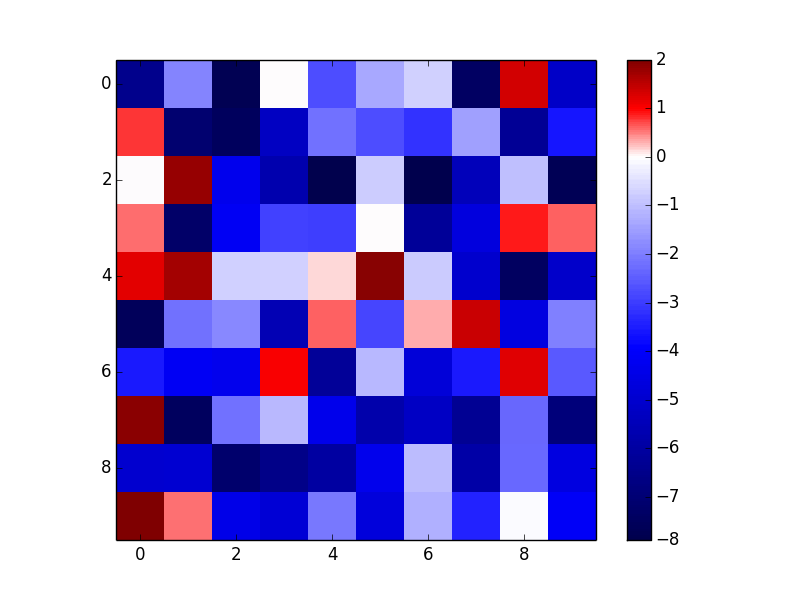
In this example, the DivergingNorm function is used and produces what I want…
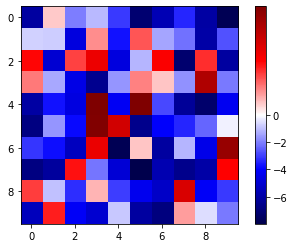
I am using a later version of Matplotlib however (3.5.1) and when I use the suggested code in the link above, I get the following image…
import numpy as np
import matplotlib.pyplot as plt

data = np.random.random((10,10))
data = 10 * (data - 0.8)

fig, ax = plt.subplots()
im = ax.imshow(data, norm=matplotlib.colors.TwoSlopeNorm(0), cmap=plt.cm.seismic, interpolation='none')
fig.colorbar(im)
plt.show()
Does anyone know how I can reproduce this behaviour from DivergingNorm from older Matplotlib verions? I can’t find a solution to this anywhere even though the older behaviour of ‘DivergingNorm’ is exactly what I want.
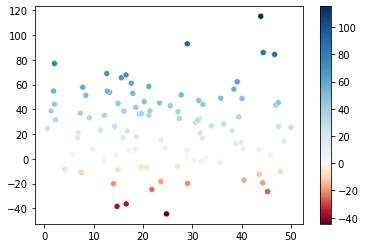
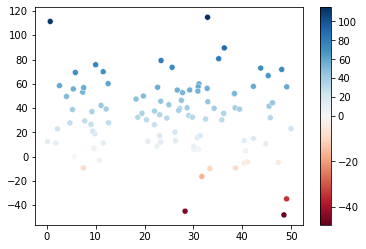
I get the same wrong behaviour using this example —> python - Seaborn plot with colorbar, centered around 0 - Stack Overflow
I should get this…
… but actually get…
Thanks!