I am trying to plot a spectrum, with lower x axis = velocity, on the upper =
frequency
The relationship between them (doppler formula) is
f = (1-v/c)*f_0
where f is the resulting frequency, v the velocity, c the speed of light,
and f_0 the frequency at v=0, ie. the v_lsr.
I have tried to solve it by looking at
http://matplotlib.sourceforge.net/examples/axes_grid/parasite_simple2.html
http://matplotlib.sourceforge.net/examples/axes_grid/parasite_simple2.html
, where it is solved by
pm_to_kms = 1./206265.*2300*3.085e18/3.15e7/1.e5
aux_trans = matplotlib.transforms.Affine2D().scale(pm_to_kms, 1.)
ax_pm = ax_kms.twin(aux_trans)
ax_pm.set_viewlim_mode("transform")
well, my problem is that it is not a simple scaling law, but a linear
function.
Anyone know how to solve this?
Magnus
···
--
View this message in context: http://old.nabble.com/Twiny-and-affine-transform-for-xlim-tp29032627p29032627.html
Sent from the matplotlib - users mailing list archive at Nabble.com.
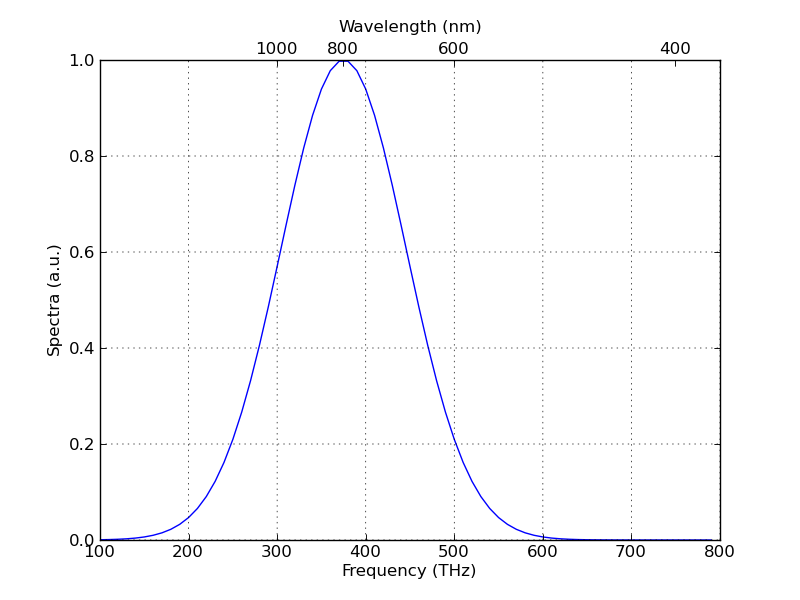
I had a similar problem when I needed to plot some data in terms of frequency and wavelength. See the attached example script.
Regards,
Jo�o Silva
example.py (790 Bytes)
···
On 06/30/2010 10:40 AM, magnus_p wrote:
I am trying to plot a spectrum, with lower x axis = velocity, on the upper =
frequency
The relationship between them (doppler formula) is
f = (1-v/c)*f_0
where f is the resulting frequency, v the velocity, c the speed of light,
and f_0 the frequency at v=0, ie. the v_lsr.
I have tried to solve it by looking at
http://matplotlib.sourceforge.net/examples/axes_grid/parasite_simple2.html
, where it is solved by
pm_to_kms = 1./206265.*2300*3.085e18/3.15e7/1.e5
aux_trans = matplotlib.transforms.Affine2D().scale(pm_to_kms, 1.)
ax_pm = ax_kms.twin(aux_trans)
ax_pm.set_viewlim_mode("transform")
well, my problem is that it is not a simple scaling law, but a linear
function.
Anyone know how to solve this?
Magnus
I finally solved it my self, after half a day of headbanging. This did the
trick for me, it is really good since it uses the values of the lower x
axis, so you do not have to go in fiddle with ticklabels etc, it also
changes values when you pan/zoom etc.
fig = pl.figure(1,figsize=(10.5,8))
fig.clf()
ax_kms = fig.add_subplot(111)
ax_kms.step(velocity, spect)
ax_hz = ax_kms.twiny()
x_1, x_2 = ax_kms.get_xlim()
ax_hz.set_xlim(calc_frequency(x_1,data.restfreq/1e9),
calc_frequency(x_2,data.restfreq/1e9))
Great!
···
--
View this message in context: http://old.nabble.com/Twiny-and-affine-transform-for-xlim-tp29032627p29041680.html
Sent from the matplotlib - users mailing list archive at Nabble.com.