In opening: Thank you very much to Stan West and John Hunter for their
help so far.
OK, I've hit either a genuine bug in Matplotlib, or a serious gap in my
understanding; probably the latter. If I missed something in the docs,
please point me that way. Attached is a test case that shows what's
going on, as well as the "bad" plots produced.
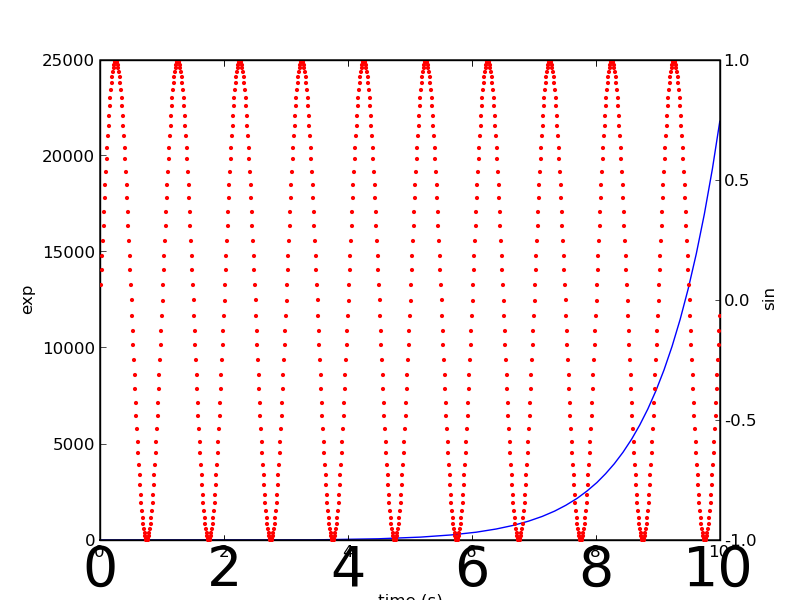
I started with the two axis example. After setting the formatters for
ax1, I set the xmajor ticks labels' font size to 40, and plot it, as
well as ax2.
That gives me a set of large X labels, and a set of small X labels. OK,
I try setting ax2's major formatter to NullFormatter(), but that makes
all the number disappear.
As can be seen from the print statements, the instances of the
formatters are the same for both ax1 and ax2, even though they are
supposed to be different axis, BUT the instances of the tick labels are
different, hence the disparity in font sizes.
So, besides the work-around of setting font sizes on both sets of tick
labels, what is the solution here?
Thanks!
j
AxisTest.py (1.26 KB)
···
--
Joshua Kugler
Part-Time System Admin/Programmer
http://www.eeinternet.com
PGP Key: http://pgp.mit.edu/ ID 0xDB26D7CE
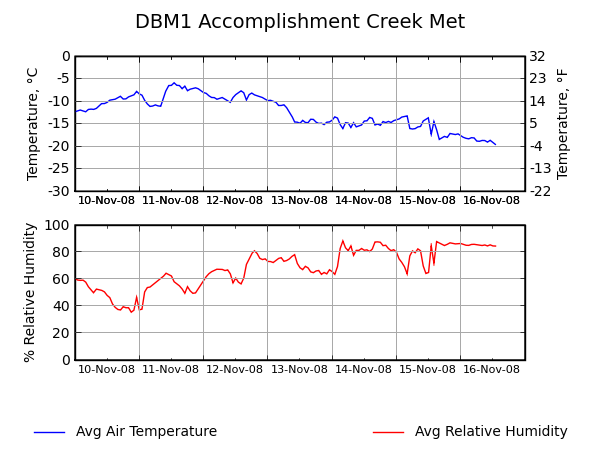
I am leaning toward this being a true bug. If you take a look at
attached plot (the code for which is where I first noticed this bug),
you'll notice that the dates on the top graph (the one with two axis)
look a little "bold" while the dates on the bottom graph look "normal."
The top set of dates are the one where I have to let font size (8) on
two different sets of tick labels.
j
···
--
Joshua Kugler
Part-Time System Admin/Programmer
http://www.eeinternet.com
PGP Key: http://pgp.mit.edu/ ID 0xDB26D7CE
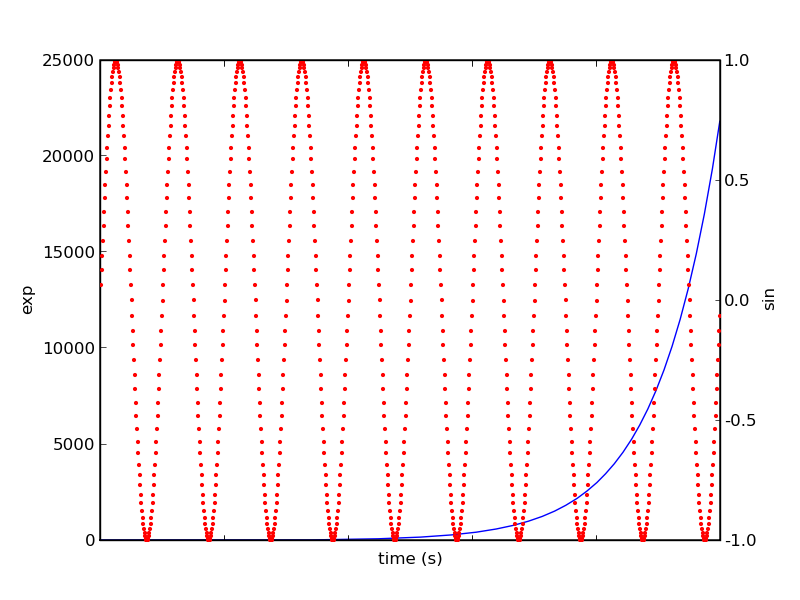
When you share an axis, the formatters and locators are shared as
well. I'm not sure if this is idea, but this is the way it is. If
you want to turn off the tick labels for ax2, the trick is to make
them invisible, because the tick properties are not shared. So
instead of using the NullLocator, do
for label in ax2.get_xticklabels():
label.set_visible(False)
Hope this helps,
JDH
···
On Sun, Nov 16, 2008 at 8:31 PM, Joshua J. Kugler <joshua@...1552...> wrote:
In opening: Thank you very much to Stan West and John Hunter for their
help so far.
OK, I've hit either a genuine bug in Matplotlib, or a serious gap in my
understanding; probably the latter. If I missed something in the docs,
please point me that way. Attached is a test case that shows what's
going on, as well as the "bad" plots produced.
I started with the two axis example. After setting the formatters for
ax1, I set the xmajor ticks labels' font size to 40, and plot it, as
well as ax2.
That gives me a set of large X labels, and a set of small X labels. OK,
I try setting ax2's major formatter to NullFormatter(), but that makes
all the number disappear.
As can be seen from the print statements, the instances of the
formatters are the same for both ax1 and ax2, even though they are
supposed to be different axis, BUT the instances of the tick labels are
different, hence the disparity in font sizes.
So, besides the work-around of setting font sizes on both sets of tick
labels, what is the solution here?
On Sunday 16 November 2008, John Hunter said something like:
When you share an axis, the formatters and locators are shared as
well. I'm not sure if this is idea, but this is the way it is. If
you want to turn off the tick labels for ax2, the trick is to make
them invisible, because the tick properties are not shared. So
instead of using the NullLocator, do
for label in ax2.get_xticklabels():
label.set_visible(False)
I figured it was something simple.
Thanks again!
j
···
--
Joshua Kugler
Part-Time System Admin/Programmer
http://www.eeinternet.com
PGP Key: http://pgp.mit.edu/ ID 0xDB26D7CE
w/o seeing the code that generated the figure it is hard to know, but
the "bold look" probably arises from rendering the same tick labels
twice in the same location, eg if you have a twinx, as it appears you
do, but haven't made the ticks invisible (as per my earlier
suggestion) on one of the axes. Perhaps we should make the ticks on
the "twin" axes invisible by default.
Also, when posting continuations related to a theme, eg your previous
post on twin axes formatters, please try to keep them in the same
thread by "replying" to yourself in the earlier thread. This makes it
easier for people following the thread to see everything in one place,
particularly those using threaded mail readers, as well as the future
generations of googlers who will pick this conversation up on mail
archive websites like nabble.
Thanks,
JDH
···
On Sun, Nov 16, 2008 at 8:38 PM, Joshua J. Kugler <joshua@...1552...> wrote:
I am leaning toward this being a true bug. If you take a look at
attached plot (the code for which is where I first noticed this bug),
you'll notice that the dates on the top graph (the one with two axis)
look a little "bold" while the dates on the bottom graph look "normal."
The top set of dates are the one where I have to let font size (8) on
two different sets of tick labels.
On Sunday 16 November 2008, John Hunter said something like:
> I am leaning toward this being a true bug. If you take a look at
> attached plot (the code for which is where I first noticed this
> bug), you'll notice that the dates on the top graph (the one with
> two axis) look a little "bold" while the dates on the bottom graph
> look "normal." The top set of dates are the one where I have to let
> font size (8) on two different sets of tick labels.
w/o seeing the code that generated the figure it is hard to know, but
the "bold look" probably arises from rendering the same tick labels
twice in the same location, eg if you have a twinx, as it appears you
do, but haven't made the ticks invisible (as per my earlier
suggestion) on one of the axes. Perhaps we should make the ticks on
the "twin" axes invisible by default.
Yup, that was it. Woohoo! Thanks!
Also, when posting continuations related to a theme, eg your previous
post on twin axes formatters, please try to keep them in the same
thread by "replying" to yourself in the earlier thread. This makes
it easier for people following the thread to see everything in one
place, particularly those using threaded mail readers, as well as the
future generations of googlers who will pick this conversation up on
mail archive websites like nabble.
Weird, in my mailer (K-Mail) I replied to my message, and it threaded it
properly when it came back. Maybe adding modifying the subject messed
up some mailers? I think K-Kmail threads based on the references in
the headers, e.g.:
References: <200811161731.42499.joshua@...1552...>
<200811161738.41425.joshua@...1552...>
And other mailers thread on subject, which might mess them up? At any
rate, sorry for glitching some people's mailers!
j
···
On Sun, Nov 16, 2008 at 8:38 PM, Joshua J. Kugler <joshua@...1552...> wrote:
--
Joshua Kugler
Part-Time System Admin/Programmer
http://www.eeinternet.com
PGP Key: http://pgp.mit.edu/ ID 0xDB26D7CE
w/o seeing the code that generated the figure it is hard to know, but
the "bold look" probably arises from rendering the same tick labels
twice in the same location, eg if you have a twinx, as it appears you
do, but haven't made the ticks invisible (as per my earlier
suggestion) on one of the axes. Perhaps we should make the ticks on
the "twin" axes invisible by default.
Yup, that was it. Woohoo! Thanks!
Great -- glad that worked. Perhaps we should fix the default behavior though...
Weird, in my mailer (K-Mail) I replied to my message, and it threaded it
properly when it came back. Maybe adding modifying the subject messed
up some mailers? I think K-Kmail threads based on the references in
the headers, e.g.:
OK, my bad. It's looks like it is just gmail that is mucking it up
(maybe other readers as well). nabble is ggeting it right:
http://www.nabble.com/Twin-axes-share-Formatters%2C-but-not-ticks-to20532903.html
No worries -- just wanted to make sure you were aware of the issue,
and it appears you are more on top of it than me 
JDH
···
On Sun, Nov 16, 2008 at 9:26 PM, Joshua J. Kugler <joshua@...1552...> wrote: