Dear matplotters,
I’m trying to follow
http://matplotlib.sourceforge.net/examples/pylab_examples/ganged_plots.html
as an example how to turn of the ticks in the case of shared x axes.
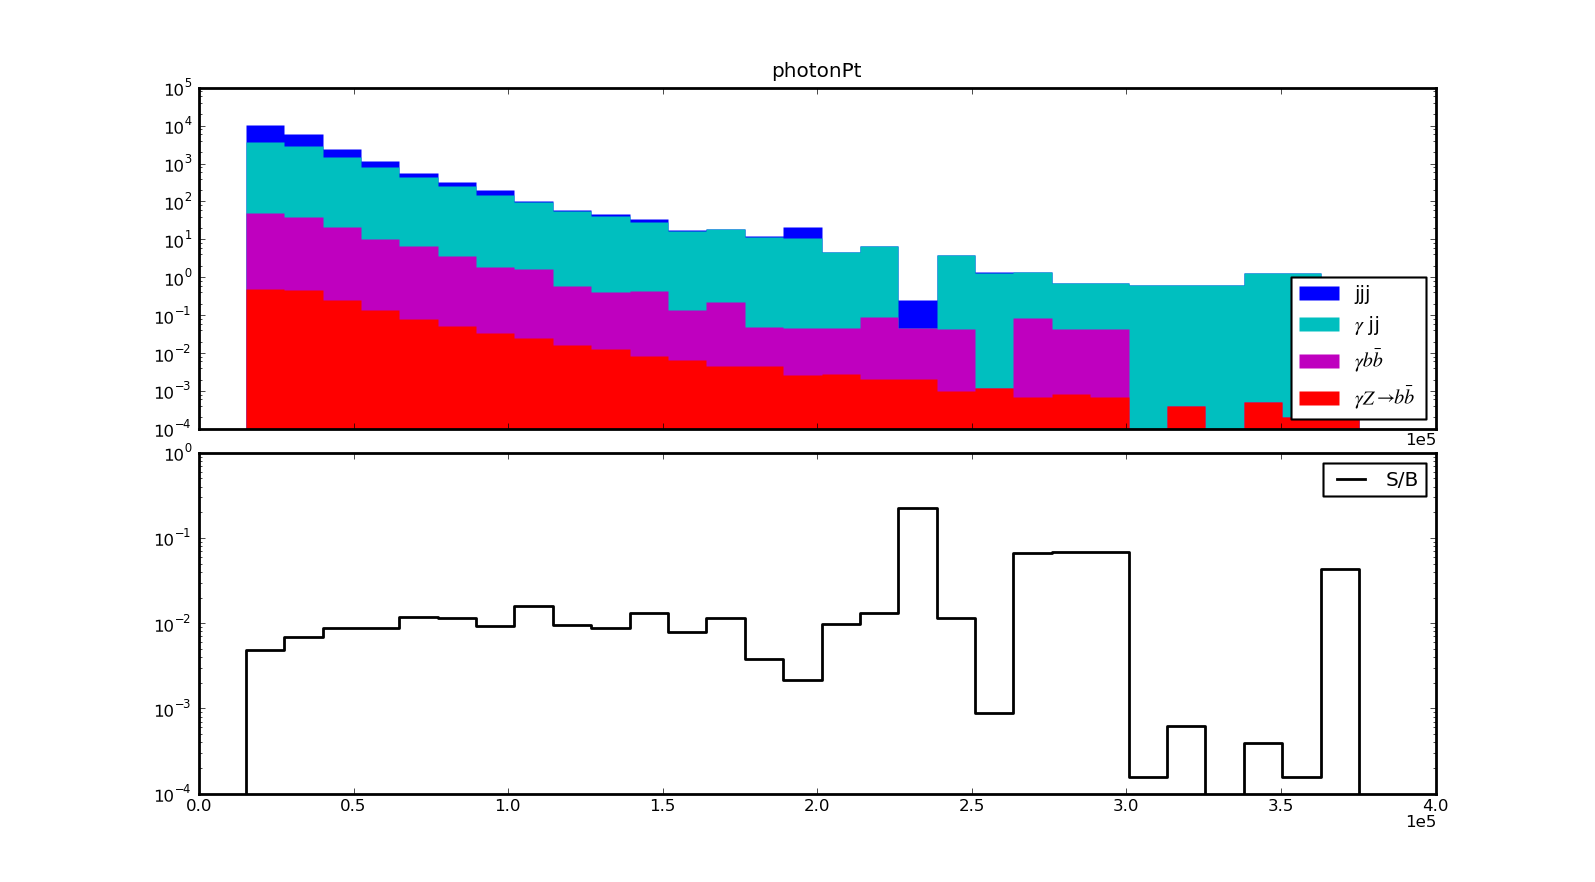
The tick labels are gone, but unfortunately, matplotlib still plots a ‘1e5’ on the axis for which I have turned off the tick labels.
Please see the attached file for the problem
How can I also switch of the exponent?
Thanks,
Jan
Try this:
ax.xaxis.set_major_formatter(mpl.ticker.ScalarFormatter(useOffset=False))
where 'ax' is the name of the top subplot.
Good luck,
Jeff
···
On Feb 14, 2010, at 5:41 PM, Jan Strube wrote:
Dear matplotters,
I'm trying to follow
http://matplotlib.sourceforge.net/examples/pylab_examples/ganged_plots.html
as an example how to turn of the ticks in the case of shared x axes.
The tick labels are gone, but unfortunately, matplotlib still plots a '1e5' on the axis for which I have turned off the tick labels.
Please see the attached file for the problem
How can I also switch of the exponent?
Thanks,
Jan
Hi Jeff,
thanks for your quick reply.
Unfortunately, the line you sent me doesn’t have any effect on the plot, either before or after turning off the tick labels.
Do you have another suggestion?
Cheers,
Jan
···
On Sun, Feb 14, 2010 at 11:28 PM, Jeffrey Blackburne <jeffb@…1166…> wrote:
On Feb 14, 2010, at 5:41 PM, Jan Strube wrote:
Dear matplotters,
I’m trying to follow
http://matplotlib.sourceforge.net/examples/pylab_examples/ganged_plots.html
as an example how to turn of the ticks in the case of shared x axes.
The tick labels are gone, but unfortunately, matplotlib still plots a ‘1e5’ on the axis for which I have turned off the tick labels.
Please see the attached file for the problem
How can I also switch of the exponent?
Thanks,
Jan
Try this:
ax.xaxis.set_major_formatter(mpl.ticker.ScalarFormatter(useOffset=False))
where ‘ax’ is the name of the top subplot.
Good luck,
Jeff
Can you send a minimal working example that shows the problem?
···
On Feb 15, 2010, at 4:50 AM, Jan Strube wrote:
Hi Jeff,
thanks for your quick reply.
Unfortunately, the line you sent me doesn't have any effect on the plot, either before or after turning off the tick labels.
Do you have another suggestion?
Cheers,
Jan
On Sun, Feb 14, 2010 at 11:28 PM, Jeffrey Blackburne > <[email protected]...> wrote:
On Feb 14, 2010, at 5:41 PM, Jan Strube wrote:
Dear matplotters,
I'm trying to follow
http://matplotlib.sourceforge.net/examples/pylab_examples/ganged_plots.html
as an example how to turn of the ticks in the case of shared x axes.
The tick labels are gone, but unfortunately, matplotlib still plots a '1e5' on the axis for which I have turned off the tick labels.
Please see the attached file for the problem
How can I also switch of the exponent?
Thanks,
Jan
Try this:
ax.xaxis.set_major_formatter(mpl.ticker.ScalarFormatter(useOffset=False))
where 'ax' is the name of the top subplot.
Good luck,
Jeff
------------------------------------------------------------------------------
SOLARIS 10 is the OS for Data Centers - provides features such as DTrace,
Predictive Self Healing and Award Winning ZFS. Get Solaris 10 NOW
http://p.sf.net/sfu/solaris-dev2dev_______________________________________________
Matplotlib-users mailing list
[email protected]
matplotlib-users List Signup and Options
Try
ax1.xaxis.offsetText.set_visible(False)
where ax1 is the upper axes.
Regards,
-JJ
···
On Mon, Feb 15, 2010 at 4:50 AM, Jan Strube <[email protected]...> wrote:
Hi Jeff,
thanks for your quick reply.
Unfortunately, the line you sent me doesn't have any effect on the plot,
either before or after turning off the tick labels.
Do you have another suggestion?
Cheers,
Jan
On Sun, Feb 14, 2010 at 11:28 PM, Jeffrey Blackburne <[email protected]...> wrote:
On Feb 14, 2010, at 5:41 PM, Jan Strube wrote:
Dear matplotters,
I'm trying to follow
http://matplotlib.sourceforge.net/examples/pylab_examples/ganged_plots.html
as an example how to turn of the ticks in the case of shared x axes.
The tick labels are gone, but unfortunately, matplotlib still plots a
'1e5' on the axis for which I have turned off the tick labels.
Please see the attached file for the problem
How can I also switch of the exponent?
Thanks,
Jan
Try this:
ax.xaxis.set_major_formatter(mpl.ticker.ScalarFormatter(useOffset=False))
where 'ax' is the name of the top subplot.
Good luck,
Jeff
------------------------------------------------------------------------------
SOLARIS 10 is the OS for Data Centers - provides features such as DTrace,
Predictive Self Healing and Award Winning ZFS. Get Solaris 10 NOW
http://p.sf.net/sfu/solaris-dev2dev
_______________________________________________
Matplotlib-users mailing list
[email protected]
matplotlib-users List Signup and Options
Yes, yes!
what he said…
Thanks a lot JJ.
Dear developers, would it make sense to have
setp(axes1.get_xticklabels(), visible=False)
also automatically set
axes1.xaxis.offsetText.set_visible(False)
?
Cheers,
Jan
···
On Mon, Feb 15, 2010 at 5:10 PM, Jae-Joon Lee <lee.j.joon@…287…> wrote:
Try
ax1.xaxis.offsetText.set_visible(False)
where ax1 is the upper axes.
Regards,
-JJ
On Mon, Feb 15, 2010 at 4:50 AM, Jan Strube <curiousjan@…287…> wrote:
Hi Jeff,
thanks for your quick reply.
Unfortunately, the line you sent me doesn’t have any effect on the plot,
either before or after turning off the tick labels.
Do you have another suggestion?
Cheers,
Jan
On Sun, Feb 14, 2010 at 11:28 PM, Jeffrey Blackburne <jeffb@…1166…> wrote:
On Feb 14, 2010, at 5:41 PM, Jan Strube wrote:
Dear matplotters,
I’m trying to follow
http://matplotlib.sourceforge.net/examples/pylab_examples/ganged_plots.html
as an example how to turn of the ticks in the case of shared x axes.
The tick labels are gone, but unfortunately, matplotlib still plots a
‘1e5’ on the axis for which I have turned off the tick labels.
Please see the attached file for the problem
How can I also switch of the exponent?
Thanks,
Jan
Try this:
ax.xaxis.set_major_formatter(mpl.ticker.ScalarFormatter(useOffset=False))
where ‘ax’ is the name of the top subplot.
Good luck,
Jeff
SOLARIS 10 is the OS for Data Centers - provides features such as DTrace,
Predictive Self Healing and Award Winning ZFS. Get Solaris 10 NOW
http://p.sf.net/sfu/solaris-dev2dev
Matplotlib-users mailing list
[email protected]
https://lists.sourceforge.net/lists/listinfo/matplotlib-users