Hello,
Let say we have a figure created by:
plt.plot(range(100))
On WX backend plt.grid(1) or key “G” responds finely for turning on/off the grid lines. However when I log-scale both axes then plt.grid(1 or 0) or “G” doesn’t respond on minor grid lines.
Is there a way to control this behavior?
Thanks.
···
–
Gökhan
Hi Gökhan,
I can confirm your findings and I hope my attached patch (against current svn)
solves this problem. In the axes.grid the boolean 'b' was set to 'True' if
the kwarg 'which' was suplied, because it was part of the **kwargs and so
always b was True in the axis (e.g. ax.xaxis).
Now I get a grid on the minor-ticks by calling:
ax.grid(True, which="majorminor")
and remove the the minortick-grid lines / all grid lines by calling
ax.grid(False, which="minor")
ax.grid(False, which="majorminor")
Kind regards,
Matthias
grid_for_major_minor_ticks.patch (1.32 KB)
···
On Sunday 18 April 2010 00:52:57 Gökhan Sever wrote:
Hello,
Let say we have a figure created by:
plt.plot(range(100))
On WX backend plt.grid(1) or key "G" responds finely for turning on/off the
grid lines. However when I log-scale both axes then plt.grid(1 or 0) or "G"
doesn't respond on minor grid lines.
Is there a way to control this behavior?
Thanks.
Works great both “majorminor” and “minormajor” works as a which keyword.
One minor thing. When I updated backend_bases.py as it doesn’t function correctly when I toggle G
    if event.key in grid_keys:
        event.inaxes.grid(which='majorminor')
        self.canvas.draw()
Could you take a look this one as well?
Thanks.
This change should go into the svn.
···
On Mon, Apr 19, 2010 at 1:31 AM, Matthias Michler <MatthiasMichler@…361…> wrote:
On Sunday 18 April 2010 00:52:57 Gökhan Sever wrote:
Hello,
Let say we have a figure created by:
plt.plot(range(100))
On WX backend plt.grid(1) or key “G” responds finely for turning on/off the
grid lines. However when I log-scale both axes then plt.grid(1 or 0) or “G”
doesn’t respond on minor grid lines.
Is there a way to control this behavior?
Thanks.
Hi Gökhan,
I can confirm your findings and I hope my attached patch (against current svn)
solves this problem. In the axes.grid the boolean ‘b’ was set to ‘True’ if
the kwarg ‘which’ was suplied, because it was part of the **kwargs and so
always b was True in the axis (e.g. ax.xaxis).
Now I get a grid on the minor-ticks by calling:
ax.grid(True, which=“majorminor”)
and remove the the minortick-grid lines / all grid lines by calling
ax.grid(False, which=“minor”)
ax.grid(False, which=“majorminor”)
Kind regards,
Matthias
–
Gökhan
Hi Gökhan,
thanks for testing this small patch. Maybe one of the developers could submit
it or should I place it on the patch-tracker?
About the toggling of all grid-lines using
event.inaxes.grid(which='majorminor')
I not sure this is intended, because this means that you will allways toggling
major and minor tick - grid lines using key 'g' instead of only toggling
major tick grid lines. Maybe a developer or other users could comment on the
preferred behavior.
Kind regards,
Matthias
···
On Monday 19 April 2010 20:36:15 Gökhan Sever wrote:
On Mon, Apr 19, 2010 at 1:31 AM, Matthias Michler > > <[email protected]...>wrote:
> On Sunday 18 April 2010 00:52:57 Gökhan Sever wrote:
> > Hello,
> >
> > Let say we have a figure created by:
> >
> > plt.plot(range(100))
> >
> > On WX backend plt.grid(1) or key "G" responds finely for turning on/off
>
> the
>
> > grid lines. However when I log-scale both axes then plt.grid(1 or 0) or
>
> "G"
>
> > doesn't respond on minor grid lines.
> >
> > Is there a way to control this behavior?
> >
> > Thanks.
>
> Hi Gökhan,
>
> I can confirm your findings and I hope my attached patch (against current
> svn)
> solves this problem. In the axes.grid the boolean 'b' was set to 'True'
> if the kwarg 'which' was suplied, because it was part of the **kwargs and
> so always b was True in the axis (e.g. ax.xaxis).
>
> Now I get a grid on the minor-ticks by calling:
>
> ax.grid(True, which="majorminor")
>
> and remove the the minortick-grid lines / all grid lines by calling
>
> ax.grid(False, which="minor")
> ax.grid(False, which="majorminor")
>
> Kind regards,
> Matthias
Works great both "majorminor" and "minormajor" works as a which keyword.
One minor thing. When I updated backend_bases.py as it doesn't function
correctly when I toggle G
if event.key in grid_keys:
event.inaxes.grid(which='majorminor')
self.canvas.draw()
Could you take a look this one as well?
Thanks.
This change should go into the svn.
Hi Gökhan,
thanks for testing this small patch. Maybe one of the developers could submit
it or should I place it on the patch-tracker?
Usually after some pinging someone picks up the code and commits in to the svn.
About the toggling of all grid-lines using
event.inaxes.grid(which=‘majorminor’)
I not sure this is intended, because this means that you will allways toggling
major and minor tick - grid lines using key ‘g’ instead of only toggling
major tick grid lines. Maybe a developer or other users could comment on the
preferred behavior.
Just create a simple plot and log-log x,y-axes and try hitting “g”. Both minor and major gridlines must be visible to get a clear view. In some cases grids clutter the figure instead of helping.
In my previous post, the main point was change in event.inaxes.grid(which=‘majorminor’) doesn’t really work as expected. Could you at least check that behavior?
···
On Tue, Apr 20, 2010 at 2:42 AM, Matthias Michler <MatthiasMichler@…361…> wrote:
Kind regards,
Matthias
Download Intel® Parallel Studio Eval
Try the new software tools for yourself. Speed compiling, find bugs
proactively, and fine-tune applications for parallel performance.
See why Intel Parallel Studio got high marks during beta.
http://p.sf.net/sfu/intel-sw-dev
Matplotlib-users mailing list
[email protected]
https://lists.sourceforge.net/lists/listinfo/matplotlib-users
–
Gökhan
Hi Matthias,
I spotted another annoyance:
Save the following lines in a file called test.py and run python test.py
import matplotlib.pyplot as plt
plt.plot(range(100))
plt.xscale(‘log’)
plt.yscale(‘log’)
ax = plt.gca()
ax.grid(False, which=‘majorminor’)
plt.show()
This doesn’t work properly in the first call. If you call it from within Ipython -pylab using run test.py again no difference. Only when you call ax.grid(False, which=‘majorminor’) grids disappear.
···
On Tue, Apr 20, 2010 at 11:11 AM, Gökhan Sever <gokhansever@…287…> wrote:
On Tue, Apr 20, 2010 at 2:42 AM, Matthias Michler <MatthiasMichler@…361…> wrote:
Hi Gökhan,
thanks for testing this small patch. Maybe one of the developers could submit
it or should I place it on the patch-tracker?
Usually after some pinging someone picks up the code and commits in to the svn.
About the toggling of all grid-lines using
event.inaxes.grid(which=‘majorminor’)
I not sure this is intended, because this means that you will allways toggling
major and minor tick - grid lines using key ‘g’ instead of only toggling
major tick grid lines. Maybe a developer or other users could comment on the
preferred behavior.
Just create a simple plot and log-log x,y-axes and try hitting “g”. Both minor and major gridlines must be visible to get a clear view. In some cases grids clutter the figure instead of helping.
In my previous post, the main point was change in event.inaxes.grid(which=‘majorminor’) doesn’t really work as expected. Could you at least check that behavior?
Kind regards,
Matthias
Download Intel® Parallel Studio Eval
Try the new software tools for yourself. Speed compiling, find bugs
proactively, and fine-tune applications for parallel performance.
See why Intel Parallel Studio got high marks during beta.
http://p.sf.net/sfu/intel-sw-dev
Matplotlib-users mailing list
[email protected]
https://lists.sourceforge.net/lists/listinfo/matplotlib-users
–
Gökhan
–
Gökhan
>>
>> Hi Gökhan,
>>
>> thanks for testing this small patch. Maybe one of the developers could
>> submit
>> it or should I place it on the patch-tracker?
>
> Usually after some pinging someone picks up the code and commits in to
> the svn.
>
>> About the toggling of all grid-lines using
>> event.inaxes.grid(which='majorminor')
>> I not sure this is intended, because this means that you will allways
>> toggling
>> major and minor tick - grid lines using key 'g' instead of only toggling
>> major tick grid lines. Maybe a developer or other users could comment on
>> the
>> preferred behavior.
>
> Just create a simple plot and log-log x,y-axes and try hitting "g". Both
> minor and major gridlines must be visible to get a clear view. In some
> cases grids clutter the figure instead of helping.
>
> In my previous post, the main point was change in
> event.inaxes.grid(which='majorminor') doesn't really work as expected.
> Could you at least check that behavior?
I think it works like expected, i.e. it toggles the state of showing grid
lines for minor and major ticks.
The problem it the case were people set only major tick grid lines
ax.grid(True, which='major')
and than press the key 'g', because than they change between having major and
minor tick grid lines and this is somehow a strange behavior, isn't it?
Therefore I myself am not convinced of that solution.
[...]
I spotted another annoyance:
Save the following lines in a file called test.py and run python test.py
import matplotlib.pyplot as plt
plt.plot(range(100))
plt.xscale('log')
plt.yscale('log')
ax = plt.gca()
ax.grid(False, which='majorminor')
plt.show()
This doesn't work properly in the first call. If you call it from within
Ipython -pylab using run test.py again no difference. Only when you call
ax.grid(False, which='majorminor') grids disappear.
I'm sorry, I don't get your point. If I ran your script I get a window without
gridlines as expected. The result is independent of the call of
ax.grid(False, which='majorminor').
By the way are you using matplotlib-svn?
Kind regards,
Matthias
···
On Wednesday 21 April 2010 08:10:00 Gökhan Sever wrote:
On Tue, Apr 20, 2010 at 11:11 AM, Gökhan Sever <[email protected]....>wrote:
> On Tue, Apr 20, 2010 at 2:42 AM, Matthias Michler > > <[email protected]... > > > > > wrote:
I think it works like expected, i.e. it toggles the state of showing grid
lines for minor and major ticks.
The problem it the case were people set only major tick grid lines
ax.grid(True, which=‘major’)
and than press the key ‘g’, because than they change between having major and
minor tick grid lines and this is somehow a strange behavior, isn’t it?
Therefore I myself am not convinced of that solution.
[…]
Interesting that setting and using “g” doesn’t toggle both minor and major grids at the same time. It behaves erratically.
event.inaxes.grid(which=‘minormajor’)
I’m sorry, I don’t get your point. If I ran your script I get a window without
gridlines as expected. The result is independent of the call of
ax.grid(False, which=‘majorminor’).
By the way are you using matplotlib-svn?
Yes I test this again and it doesn’t work. That setting only disables major grids. Grids are cleared in my second explicit call. This is rev 8226 using WXAgg backend.
···
On Wed, Apr 21, 2010 at 4:39 AM, Matthias Michler <MatthiasMichler@…361…> wrote:
Kind regards,
Matthias
Matplotlib-users mailing list
[email protected]
https://lists.sourceforge.net/lists/listinfo/matplotlib-users
–
Gökhan
I removed mpl directory and re-checked out and re-installed it using rev 8260.
Applied your patch with patch -p0 -i grid_for_major_minor_ticks.patch
That simple example still doesn’t work here (cannot get rid of major - minor grids at the same in a double log scaled plot). Could someone confirm this behaviour?
Thanks.
···
On Wed, Apr 21, 2010 at 12:06 PM, Gökhan Sever <gokhansever@…287…> wrote:
On Wed, Apr 21, 2010 at 4:39 AM, Matthias Michler <MatthiasMichler@…361…> wrote:
I think it works like expected, i.e. it toggles the state of showing grid
lines for minor and major ticks.
The problem it the case were people set only major tick grid lines
ax.grid(True, which=‘major’)
and than press the key ‘g’, because than they change between having major and
minor tick grid lines and this is somehow a strange behavior, isn’t it?
Therefore I myself am not convinced of that solution.
[…]
Interesting that setting and using “g” doesn’t toggle both minor and major grids at the same time. It behaves erratically.
event.inaxes.grid(which=‘minormajor’)
I’m sorry, I don’t get your point. If I ran your script I get a window without
gridlines as expected. The result is independent of the call of
ax.grid(False, which=‘majorminor’).
By the way are you using matplotlib-svn?
Yes I test this again and it doesn’t work. That setting only disables major grids. Grids are cleared in my second explicit call. This is rev 8226 using WXAgg backend.
Kind regards,
Matthias
Matplotlib-users mailing list
[email protected]
https://lists.sourceforge.net/lists/listinfo/matplotlib-users
–
Gökhan
–
Gökhan
Hi Gökhan,
with the attached test.py I generated the attached files 'pic?.png' and I'm
sorry, I don't get the problem. For me ax.grid(False, which='majorminor')
removes major and minor ticks on x- and y-axis.
Maybe I changed something additionally in my svn (rev 8242) and therefore get
the expected behavior. But unfortunately I cannot test it today.
Kind regards,
Matthias
test.py (557 Bytes)
···
On Wednesday 21 April 2010 20:29:23 Gökhan Sever wrote:
On Wed, Apr 21, 2010 at 12:06 PM, Gökhan Sever <[email protected]....>wrote:
> On Wed, Apr 21, 2010 at 4:39 AM, Matthias Michler > > <[email protected]... > > > > > wrote:
>>
>> I think it works like expected, i.e. it toggles the state of showing
>> grid lines for minor and major ticks.
>> The problem it the case were people set only major tick grid lines
>> ax.grid(True, which='major')
>> and than press the key 'g', because than they change between having
>> major and
>> minor tick grid lines and this is somehow a strange behavior, isn't it?
>> Therefore I myself am not convinced of that solution.
>> [...]
>
> Interesting that setting and using "g" doesn't toggle both minor and
> major grids at the same time. It behaves erratically.
> event.inaxes.grid(which='minormajor')
>
> I'm sorry, I don't get your point. If I ran your script I get a window
>
>> without
>> gridlines as expected. The result is independent of the call of
>> ax.grid(False, which='majorminor').
>> By the way are you using matplotlib-svn?
>
> Yes I test this again and it doesn't work. That setting only disables
> major grids. Grids are cleared in my second explicit call. This is rev
> 8226 using WXAgg backend.
>
>> Kind regards,
>> Matthias
> --
> Gökhan
I removed mpl directory and re-checked out and re-installed it using rev
8260.
Applied your patch with patch -p0 -i grid_for_major_minor_ticks.patch
That simple example still doesn't work here (cannot get rid of major -
minor grids at the same in a double log scaled plot). Could someone confirm
this behaviour?
Thanks.
Hi Gökhan,
Just to make one point clear to me. Do you agree that the following is the
expected behavior of your suggestion to use
event.inaxes.grid(which='minormajor') after 'g'?
If only the major tick grid lines are shown and the user presses 'g' the major
tick lines are removed and the minor tick lines are shown, because calling
Axes.grid with the default b=None toggles the state of plotting grid lines.
Here this means that the minor tick grid lines are switched from being not
shown to being shown and the major tick lines change vice versa.
If you agree that this is the expected behavior of your suggestion, do you
think this is a useful behavior?
Kind regards,
Matthias
···
On Wednesday 21 April 2010 19:06:09 Gökhan Sever wrote:
On Wed, Apr 21, 2010 at 4:39 AM, Matthias Michler > > <[email protected]...>wrote:
> I think it works like expected, i.e. it toggles the state of showing grid
> lines for minor and major ticks.
> The problem it the case were people set only major tick grid lines
> ax.grid(True, which='major')
> and than press the key 'g', because than they change between having major
> and
> minor tick grid lines and this is somehow a strange behavior, isn't it?
> Therefore I myself am not convinced of that solution.
> [...]
Interesting that setting and using "g" doesn't toggle both minor and major
grids at the same time. It behaves erratically.
event.inaxes.grid(which='minormajor')
The problem was on my side Matthias. I had enabled grid=True in my matplotlibrc file. Turned it off and I get the same behavior as you get. Thanks for providing the script and comments.
···
On Thu, Apr 22, 2010 at 3:25 AM, Matthias Michler <MatthiasMichler@…361…> wrote:
Hi Gökhan,
with the attached test.py I generated the attached files ‘pic?.png’ and I’m
sorry, I don’t get the problem. For me ax.grid(False, which=‘majorminor’)
removes major and minor ticks on x- and y-axis.
Maybe I changed something additionally in my svn (rev 8242) and therefore get
the expected behavior. But unfortunately I cannot test it today.
Kind regards,
Matthias
–
Gökhan
Hi again,
With grid state initially off I could get what I really wanted with “g” toggling after setting in backend_bases.py event.inaxes.grid(which='majorminor)
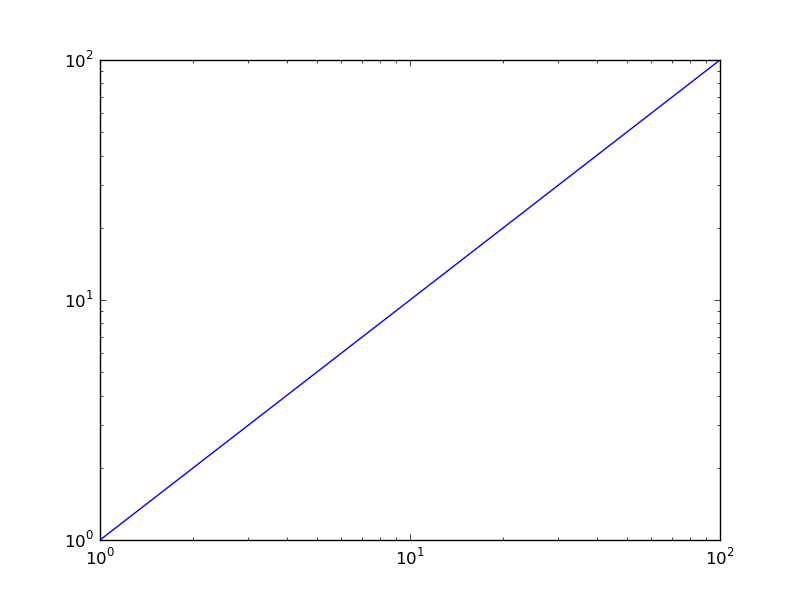
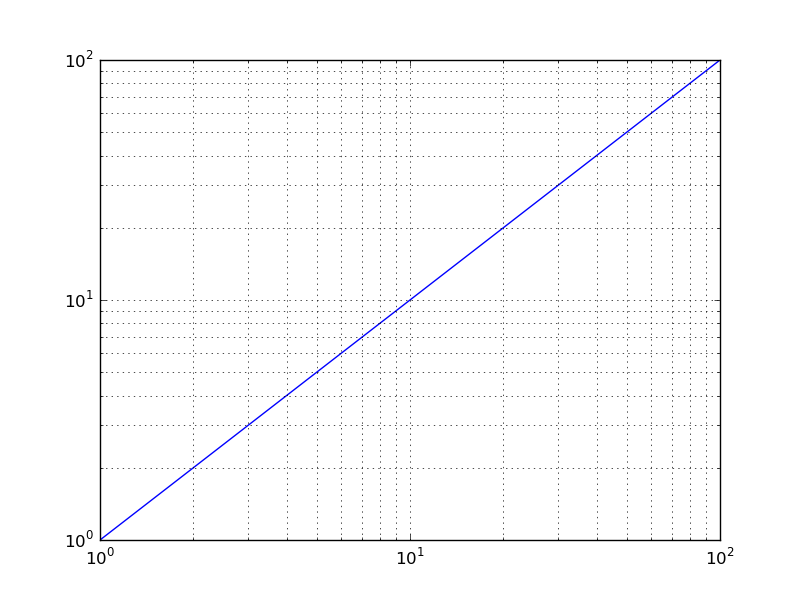
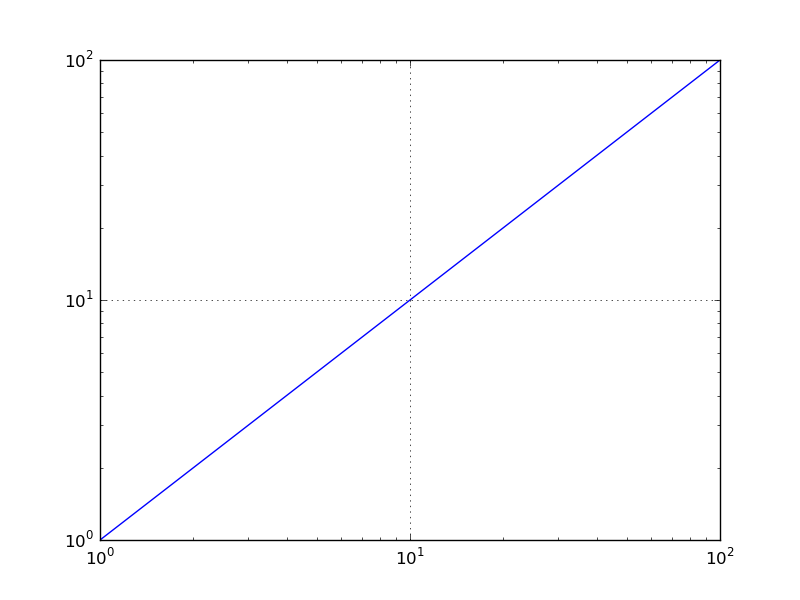
It does exactly what it supposed to do -toggle visible grids. See my figure for a clearer description: http://img249.imageshack.us/img249/1464/gridimage.png
The top-left figure has major-minor grids enabled in log-log view. This creates not a pretty image --neither on screen nor when I save the image as png or pdf. Top-right is clear since it is spaced linearly. The last figure I toggled with “g” key. It was originally like the first figure on the screen. I realize also that grid accept alpha keyword, however I couldn’t get a satisfying result out of that either. For the time being I will go with full-off grids for my step plots.
With this said, I still think event.inaxes.grid(which='majorminor) should be checked-in since it is the right behavior for full grid toggling. That’s what toggling is about right? Either all or none --we don’t want gray areas.
···
On Thu, Apr 22, 2010 at 3:42 AM, Matthias Michler <MatthiasMichler@…361…> wrote:
Hi Gökhan,
Just to make one point clear to me. Do you agree that the following is the
expected behavior of your suggestion to use
event.inaxes.grid(which=‘minormajor’) after ‘g’?
If only the major tick grid lines are shown and the user presses ‘g’ the major
tick lines are removed and the minor tick lines are shown, because calling
Axes.grid with the default b=None toggles the state of plotting grid lines.
Here this means that the minor tick grid lines are switched from being not
shown to being shown and the major tick lines change vice versa.
If you agree that this is the expected behavior of your suggestion, do you
think this is a useful behavior?
Kind regards,
Matthias
–
Gökhan