Hi all,
I don't like having to specify the marker on each call to plot(). So I
have something like this in my code:
import pylab as _p
_p.rc('lines', marker = 'o')
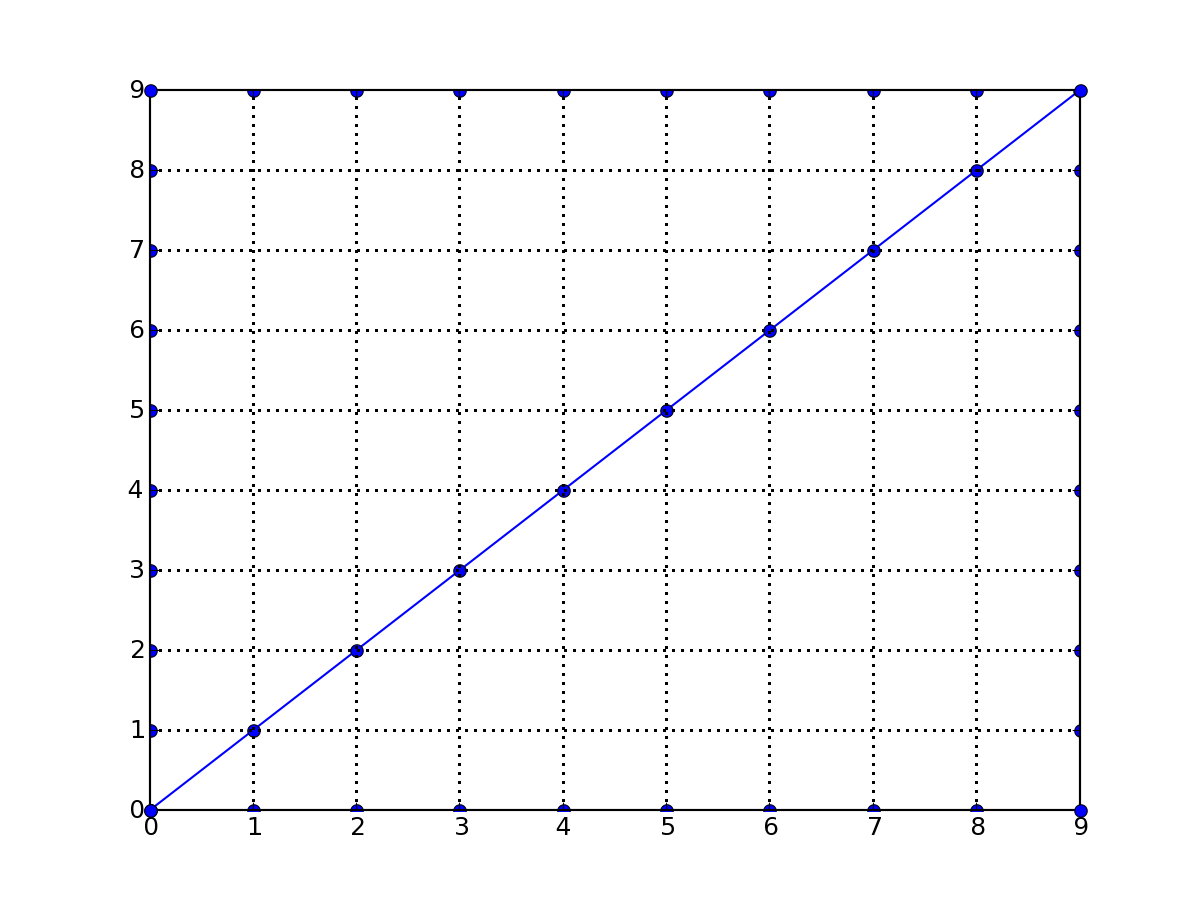
This works pretty well in the sense that each call to plot by default
uses the 'o' marker. However, now my graphs have markers on the axes
as well. I'm attaching a sample graph as an example.
So:
a) is this intended behavior? If so, whats the reasoning?
b) how can I turn it off? (btw, I just discovered that with
grid(True), the markers appear on each major tick. With grid(False),
they only appear at the corners. Doesn't solve the problem entirely
though).
Thanks,
Diwaker
···
--
Web/Blog/Gallery: http://floatingsun.net/blog