Hi
I am running the following snippet
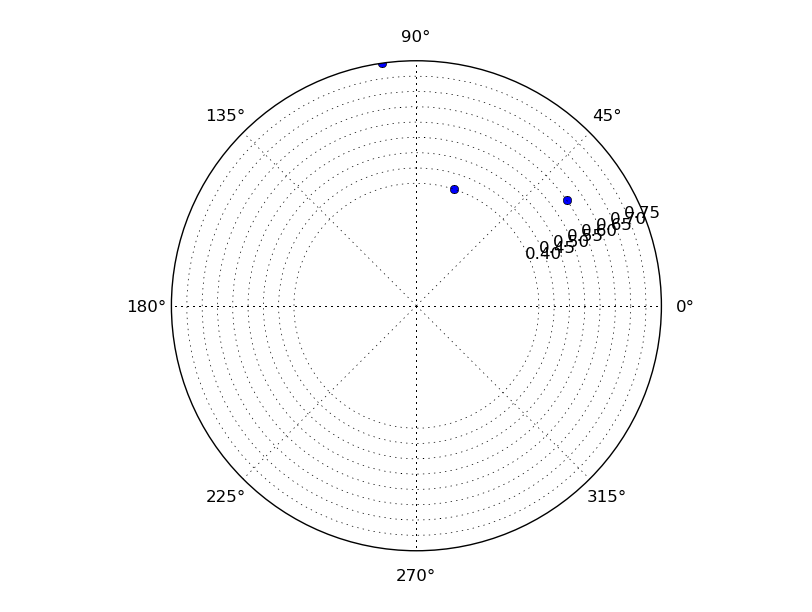
ax = axes(polar=True)
polar(angles,mag,‘bo’)
and I get the attached plot
How do make the dashed lines continue inward? How do
choose the spacing? How do remove the ugly text?
Mathew
Hi
I am running the following snippet
ax = axes(polar=True)
polar(angles,mag,‘bo’)
and I get the attached plot
How do make the dashed lines continue inward? How do
choose the spacing? How do remove the ugly text?
Mathew
Hi Mathew,
Hi
I am running the following snippet
ax = axes(polar=True)
polar(angles,mag,'bo')
please include a full, working example: with this so few information
we can help a little.
and I get the attached plot
no attached image.
How do make the dashed lines continue inward? How do choose the spacing?
How do remove the ugly text?
could at least rgrids() thetagrids() help you in part of your questions?
Regards,
On Tue, Jun 16, 2009 at 21:20, Yeates, Mathew C<mathew.c.yeates@...369...> wrote:
--
Sandro Tosi (aka morph, morpheus, matrixhasu)
My website: http://matrixhasu.altervista.org/
Me at Debian: http://wiki.debian.org/SandroTosi
Oops
-----Original Message-----
From: Sandro Tosi [mailto:matrixhasu@…287…]
Sent: Tuesday, June 16, 2009 12:41 PM
To: Yeates, Mathew C
Cc: matplotlib-users@lists.sourceforge.net
Subject: Re: [Matplotlib-users] trying to plot polar data
Hi Mathew,
On Tue, Jun 16, 2009 at 21:20, Yeates, Mathew C<mathew.c.yeates@...369...> wrote:
Hi
I am running the following snippet
ax = axes(polar=True)
polar(angles,mag,'bo')
please include a full, working example: with this so few information
we can help a little.
and I get the attached plot
no attached image.
How do make the dashed lines continue inward? How do choose the spacing?
How do remove the ugly text?
could at least rgrids() thetagrids() help you in part of your questions?
Regards,
--
Sandro Tosi (aka morph, morpheus, matrixhasu)
My website: http://matrixhasu.altervista.org/
Me at Debian: http://wiki.debian.org/SandroTosi