John,
Thanks for your help. I'm still having a bit of trouble.
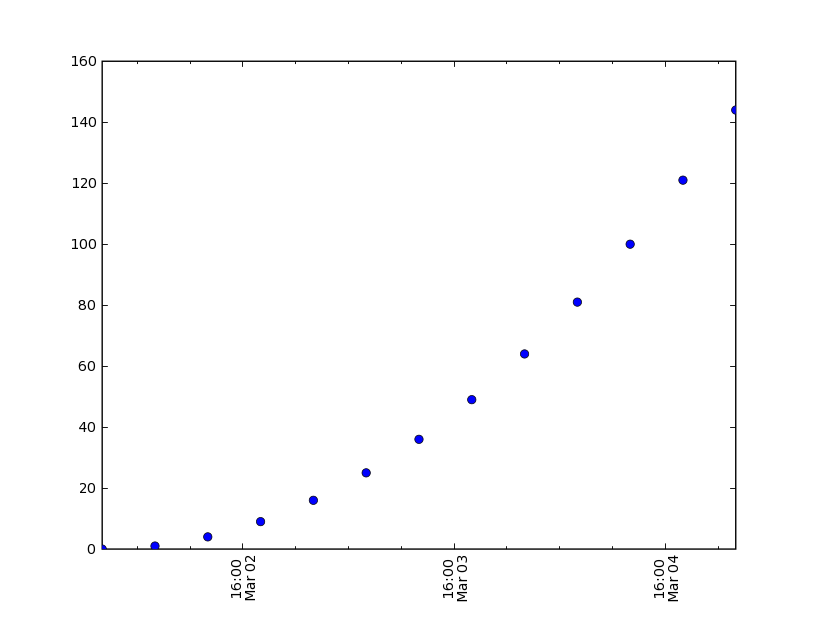
Enclosed is the code and plot. I cannot figure out why the major ticks are at hour 16.
What I want is for the major ticks to be at 2mar 00, 3 mar 00 etc. i.e. start at the xaxis origin.
Thanks for any help.
Jim
import matplotlib
matplotlib.use('TkAgg')
from matplotlib import matlab
ML = matlab
from matplotlib.ticker import YearLocator, MonthLocator, DateFormatter, DayLocator,HourLocator, DayMultiLocator
import datetime
from matplotlib.dates import PyDatetimeConverter
pydates = PyDatetimeConverter()
date1 = datetime.datetime( 2000, 3, 2, 0)
date2 = datetime.datetime( 2000, 3, 5, 0)
delta = datetime.timedelta(hours=6)
dates = []
d = date1
while d <= date2:
dates.append(d)
d = d + delta
eDates = [ pydates(d) for d in dates ]
y = ML.arrayrange( len(dates)*1.0)
ysq = y*y
majorTick = DayLocator(0)
minorTick = HourLocator(6)
ax = ML.subplot(111)
ax.plot_date(dates, ysq, pydates)
ax.set_xlim( (pydates(dates[0]), pydates(dates[-1])) )
ax.xaxis.set_major_locator(majorTick)
ax.xaxis.set_minor_locator(minorTick)
labels = ax.get_xticklabels()
ML.set(labels,'rotation', 90)