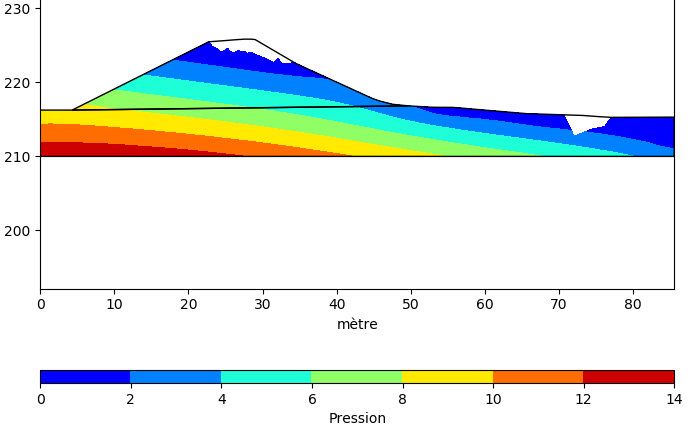
I visualize some data on a tricontourf plot that I parametrized like that :
tricontourf(x, y,
triangles,
values,
vmin=0,
vmax=np.max(values),
cmap=‘jet’)
What i want is not to display all the value less than 0.
I’ve tried using “mask” options but it hides the whole triangles i designed to mask :