Hi everyone,
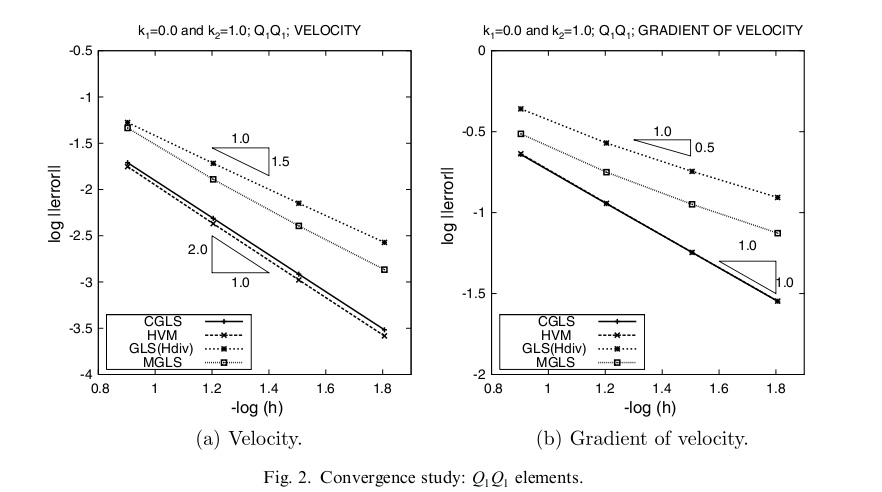
I would like to know if it is possible (I guess it is) and how can I do a plot such as the one in the attached figure?
Could someone help me with this? I know that this one was done in gnuplot, but I would like to use matplotlib.
Thanks in advance.
Bernardo M. R.
Hi Bernardo,
I have some functions which I use to draw slope markers (attached). There are examples of how to use it in the if-main block at the bottom of the file. It should be simple enough to use and works for linear and log scales.
The functions have grown sort of organically, so they're not as polished as they could be. In particular, the handling of linear/log scales could be refactored (probably by making slope marker a subclass of Polygon). Anyway, I haven't gotten around to cleaning things up, but the functions are very usable as is.
Hope that helps,
-Tony
slope_marker.py (4.26 KB)
···
On Sep 9, 2010, at 10:53 AM, Bernardo Rocha wrote:
Hi everyone,
I would like to know if it is possible (I guess it is) and how can I do a plot such as the one in the attached figure?
Could someone help me with this? I know that this one was done in gnuplot, but I would like to use matplotlib.
Thanks in advance.
Bernardo M. R.