I want to use Times New Roman font as default in a couple of figures to blend well with the (required) article text font.
This used to work fine in matplotlib 1.5.3 (which I used when I last had that requirement). By now, the following
import matplotlib.pyplot as plt
plt.rcParams["font.family"] = "serif"
plt.rcParams["font.serif"] = "Times New Roman"

plt.plot([1,2,3])
plt.xlabel('title')
plt.savefig("test.png")
plt.show()
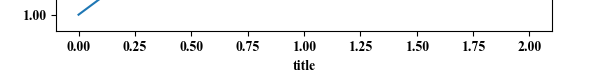
gives
As you can see, the font is Times New Roman, but the font weight is bold.
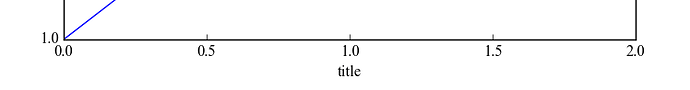
In matplotlib 1.5.3 it gave
and matplotlib always selects timesbd.ttf. I.e. DEBUG:matplotlib.font_manager:findfont: Matching :family=serif:style=normal:variant=normal:weight=normal:stretch=normal:size=10.0 to Times New Roman ('C:\\Windows\\Fonts\\timesbd.ttf') with score of 0.145000.
Hence manually selecting the font weight via plt.rcParams["font.weight"] = 100 (also trying other weights), does not help.
So the solution would need to be to explicitely select a particular font (instead of its name).
Trying plt.rcParams["font.serif"] = "C:\\Windows\\Fonts\\times.ttf" does not work. Neither does plt.rcParams["font.serif"] = FontProperties(fname="C:\\Windows\\Fonts\\times.ttf")
So the question is: How do I use a particular font (file) for the whole document?
font properties are not correctly inferred from the font file, i.e. matplotlib does not realize that timesb.ttf is a bold font: this should essentially be fixed by porting https://github.com/anntzer/freetypybind/blob/master/lib/freetypybind/query_face.py to matplotlib (after adapting it to use ft2font rather than freetypybind).
it is too difficult to select a font by path: see https://github.com/matplotlib/matplotlib/issues/10249 for a list of issues with FontProperties; for the specific case at hand I think any place that supports a font(properties) kwarg should also support a pathlib.Path argument, which can unequivocally be interpreted as a path to a font file.
I would guess that whether times.ttf or timesb.ttf gets selected comes down to the order in which they appear in fontList.json, which is basically random, you may be able to just delete timesb.ttf from fontList.json as a stopgap…
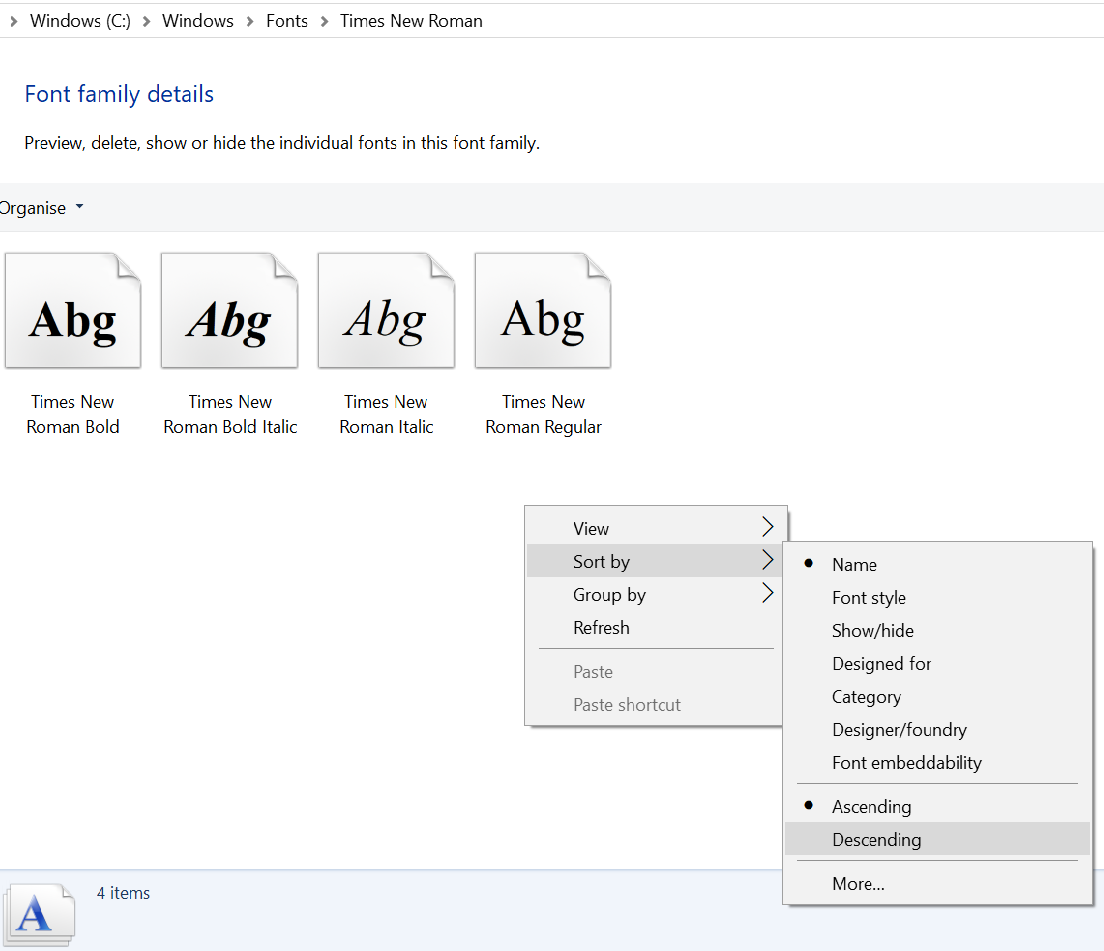
I know this is an old post, but in case someone still didn’t get it right then I suggest another solution that worked for me. The font selection algorithm picks the first font in the Time New Roman family, which has four different files (bold, bold italic, italic and regular). So the steps would be:
Go to C:\Windows\Fonts\Times New Roman
Right-click → Sort by → Descending (the order will change so the Times New Roman Regular will end up as the first font, and that will be the font the algorithm will choose).