Tikzpicture cropped from .dvi before ingestion in figure via plt.text()

Disclaimer: I fully understand that the use of text.latex.preamble in rcparams is not officially supported.

Dear hive mind,

I need/want to use the tikz LaTeX package to draw symbols in matplotlib plt.text() calls. It all works smoothly (in the sense that I get no LaTeX/matplotlib errors) … except that no symbols are actually drawn ?!

Here is a MWE:

from matplotlib import pyplot as plt

plt.style.use('./latex.mplstyle')

plt.close(1)
plt.figure(1, figsize=(4, 3))
plt.text(0.5, 0.7, r'This is regular text', ha='center', va='center')
plt.text(0.5, 0.5, r'$\rightarrow$ \begin{tikzpicture}\draw [thick] (0,0) circle [radius=2ex];\end{tikzpicture}', ha='center', va='center')
plt.savefig('test.png')
plt.show()

The content of latex.mplstyle is:

text.usetex: True
text.latex.preamble: \usepackage{tikz}

The output looks like that:
test

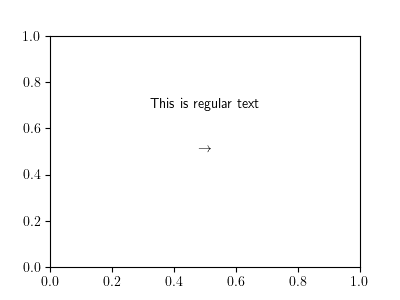
Problem: there should be a circle to the right of the arrow.
And see how the arrow is neatly centered ? This suggests that the tikzpicture is simply not being generated.

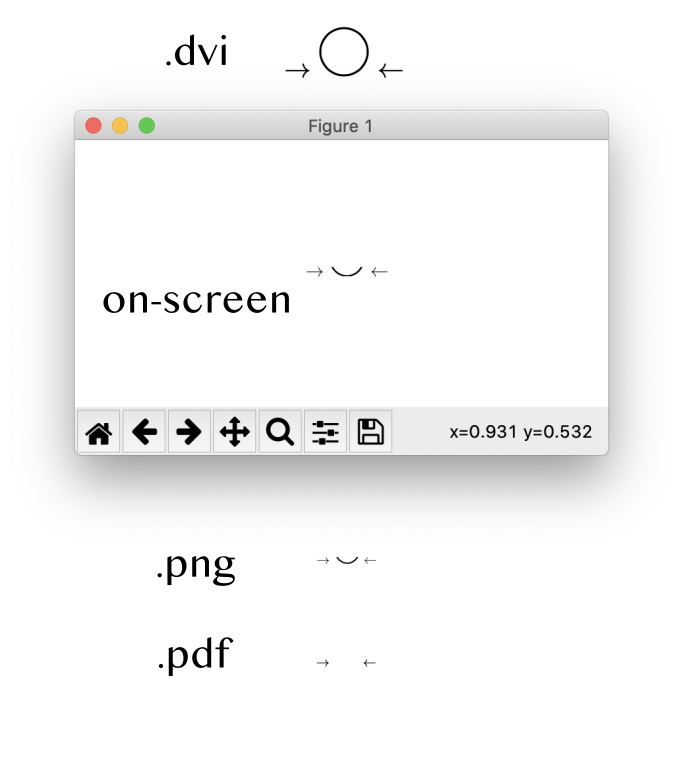
So what could matplotlib be doing differently compared to pdflatex that returns the following image:

Screenshot 2021-08-13 at 09.44.13|218x208
As a new user, it appears that I cannot embed two pictures in this post. This image shows an arrow and a circle, like so: ->O)

when processing the following (same) LaTeX code:

\documentclass[11pt]{article}

\usepackage{tikz}

\begin{document}

$\rightarrow$ \begin{tikzpicture}\draw [thick] (0,0) circle [radius=2ex];\end{tikzpicture}

\end{document}

Can anyone think of something obvious ? The tikz package is definitely being loaded correctly, as the \tikzpicture command does not raise any error when compiling the matplotlib figure. So is it a matter of some multiple latex compilations missing for matplotlib ?

Any suggestion will be greatly appreciated !

Side-note 1: as far as I can tell, the same bug behavior implies that symbols from the tikzsymbols LaTeX package do not appear either in plt.text() calls.
Side-note 2: I evidently need to draw more (but not THAT much more) than a circle with tikz … That’s just the MWE!

For the record, the same question was posted on StackOverflow, to try to also reach a wider “tikz/LaTeX audience”.

A new piece of information came to light. When I look inside my .matplotlib/.tex.cache, I can see the .tex and .dvi files generated by the process. And surprise, the .dvi contains the tikz circle !

The question then becomes: what happens to the TeX-generated .dvi file before it gets included in the figure by matplotlib ?

Edit: this got me thinking … is the circle being cropped somehow ?
I’ve modified the plt command as follows, to include an arrow on either side of the circle:

plt.text(0.5, 0.5,
         r'$\rightarrow$ \begin{tikzpicture}\draw [thick] (0,0) circle [radius=2ex];\end{tikzpicture} $\leftarrow$',
         ha='center', va='center')

And here’s what I see in the .dvi, on-screen, in the .png, and in the .pdf:

Conclusions (:question:) :

  • The LaTeX commands get processed ok and generate an accurate .dvi file.
  • “Something” crops the .dvi before ingestion in the figure. And that “something” isn’t aware of the tikz circle existence.
  • “Something (else ?)” is even smarter when saving to .pdf, and keeps precisely only the elements it knows about.

=> What is this “something” ?

Matplotlib requires font metrics like the baseline, ascends and descends. It doesn’t just paste the dvi because typographically that would be a mess. Your tikz picture does not provide any of those metrics and hence they are not included in the crop of the dvi.

Put another way, if you’d used any other latex environment, say table or includegraphics, would you expect them to be properly displayed via a text command?

If I needed to do this, I’d make a high res image and display it using imshow and maybe an inset axes at the location you would like it.

I see. I’ve used tikz to create specific symbols, hoping to be able to insert them in plot labels/legends/etc … as needed, and created a dedicated LaTeX package to that end.

I was using metafont initially (to create the symbols), but then switched to tikz to get scalable ones, along the lines of the tikzsymbols LaTeX package. Which you could argue maybe not the best approach to start with, if one wants to design new font characters.

At this point, I suppose I can either try to find a way to add the missing font metrics to the LaTeX package (which I’m not sure can even be done), or drop tikz entirely and define a proper font with all the required metrics.

You may want to consider using the pgf backend, which does support tikz (e.g., savefig(..., backend="pgf"); note that the preamble goes to pgf.preamble rather than text.latex.preamble) and can directly output pdf and png.
Unfortunately, directly supporting tikz in the “standard” backends would be (AFAICT) very tricky, because tikz effectively outputs shapes using postscript (or pdf) commands, which we cannot interpret.

Brilliant suggestion ! Thanks also for the crucial hint about pgf.preamble, that I did not know about. It works very well that way, I can successfully create png and pdf with the tikzpicture element included. In fact, I can also include the symbols from the tikzsymbols LaTeX package.

`plt.text(0.5, 0.5, r’\pot’) → Screenshot 2021-08-16 at 16.40.35

Of course, I still do not see the symbols displayed on-screen (since this does not go through the pgf backend), but that is a fair price to pay for such a “creative” way of drawing custom “text” symbols :slight_smile:

Down the line, I may try to assemble my own “font” to store my symbols as proper characters, and have them accessible in all backends … but for now, the pgf backend is a perfect solution. Thanks !

@jklymak, @anntzer.lee : if ok for you, I’ll summarize your answers on the SO question to close that one. Unless you want to answer yourself, and get the credit and associated reputation perks ?

Feel free to summarize my answer on SO.