Hi John,
I'm wondering how to set the fontsize of the ticklabels on an axis (y
axis in this case). I would like to do something as shown in the third
line of code:
.
.
.
graph_axes.set_xlim([0,24])
graph_axes.set_ylim([0,MaxHourlyDowntime+100])
graph_axes.set_yticklabels(fontsize=6)
.
.
.
but that won't work, because I'm not supply a list of ticklabels. Is
there a simple answer to this? (I've looked through the mailing lists
and the class library documentation with no success...
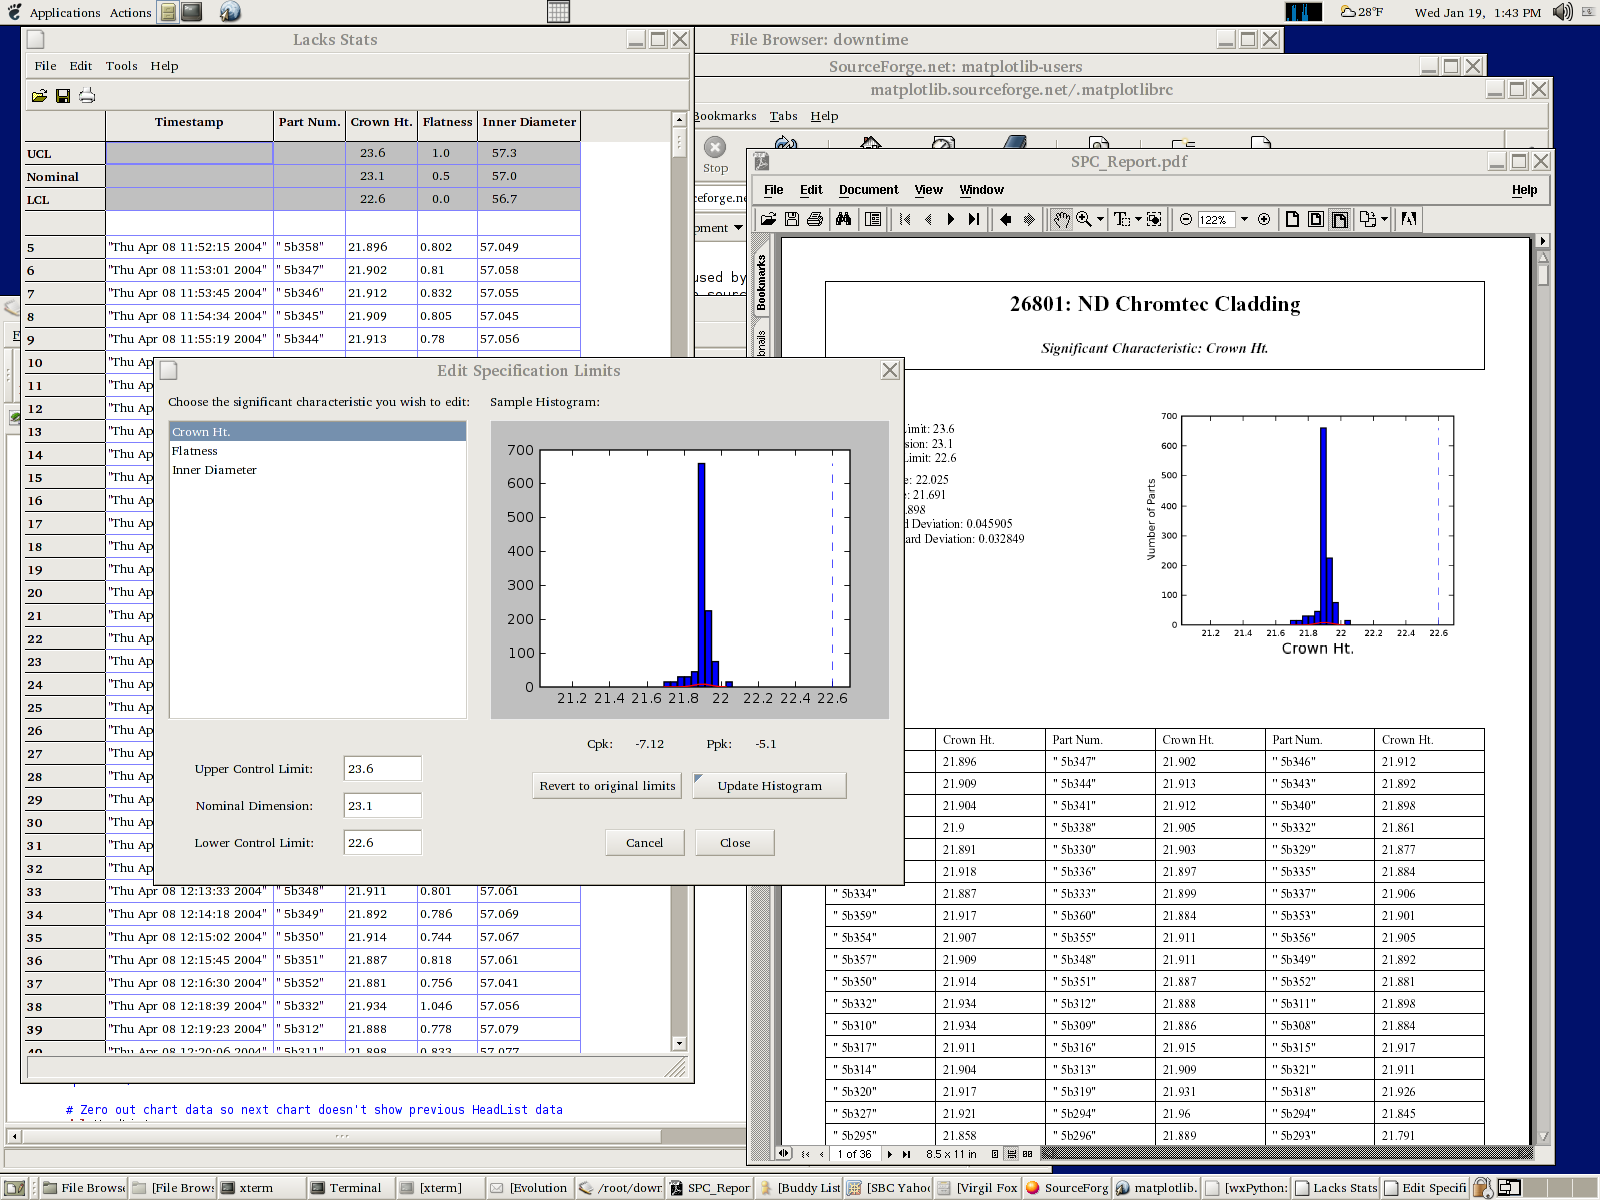
Also, attached is a screenshot of an statistical application that is
almost complete... all of the graphing and plotting functions are 100%
complete and work courtesy of matplotlib. (you had helped me with a few
issues last year and requested a screen shot...)
Thanks in advance,
Dave Engelsma