The tool tip values collide with the graph. Also, while zooming the graph, the tool tip values goes out of the graph area. Below are the screenshots:
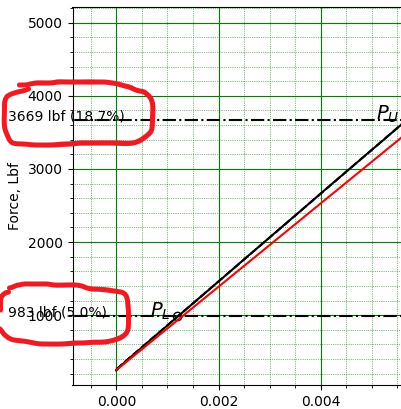
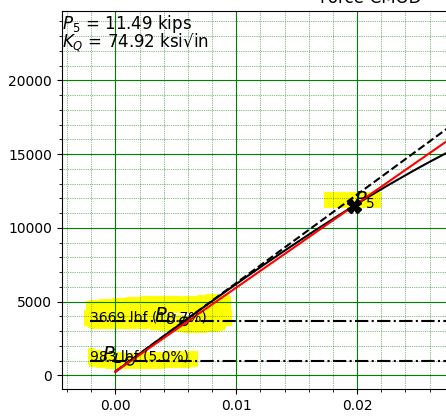
Can anyone provide the solution for these issues
The tool tip values collide with the graph. Also, while zooming the graph, the tool tip values goes out of the graph area. Below are the screenshots:
Can anyone provide the solution for these issues
It is hard to be sure without seeing the code, but my guess is that you are using ax.text or ax.annotation and placing the text via data coordinates.
I suggest looking at Annotations — Matplotlib 3.7.1 documentation for ways you can place the text in other coordinate systems or offset from the data points.
For anything more specific we would need a (minimal) code example of what you have tried to start from.