There is a github issue related this discuss: https://github.com/matplotlib/matplotlib/issues/26441
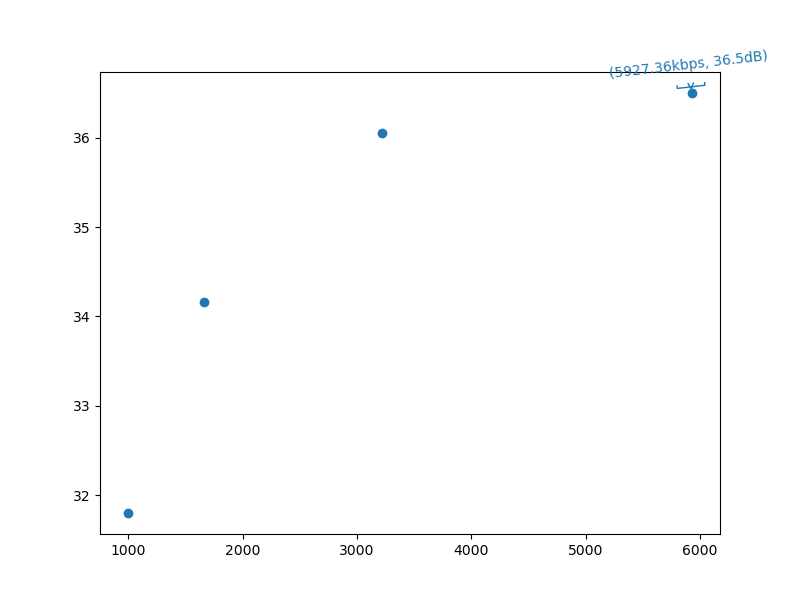
When using ax.annotate to draw text with arrow, the text is not aligned with the arrow. You can see some texts are overlapping with the arrow, but some texts are far away from arrow:
import matplotlib.pyplot as plt

anchor_rate = [1000, 1660.89, 3220.62, 5927.36]
anchor_psnr = [31.799098, 34.155477, 36.053423, 36.5]

fig, ax = plt.subplots(figsize=(8, 6))
ax1, = ax.plot(anchor_rate, anchor_psnr, marker="o", linestyle="", color='#1f77b4', label="Anchor")

ax.annotate(f"(5927.36kbps, 36.5dB)",
            (5927.36, 36.5),
            textcoords="offset points",
            arrowprops=dict(arrowstyle="]->", connectionstyle="arc3", color='#1f77b4'),
            xycoords='data',
            xytext=(-1.6921283813438717, 14.904251123120897),
            color='#1f77b4',
            ha='center',
            va='bottom',
            transform_rotates_text=True, rotation=6.47724215379907, rotation_mode='anchor'
            )

plt.show()
But when adding bbox parameter to ax.annotate, the text seems aligned:
import matplotlib.pyplot as plt

anchor_rate = [1000, 1660.89, 3220.62, 5927.36]
anchor_psnr = [31.799098, 34.155477, 36.053423, 36.5]

fig, ax = plt.subplots(figsize=(8, 6))
ax1, = ax.plot(anchor_rate, anchor_psnr, marker="o", linestyle="", color='#1f77b4', label="Anchor")

ax.annotate(f"(5927.36kbps, 36.5dB)",
            (5927.36, 36.5),
            textcoords="offset points",
            arrowprops=dict(arrowstyle="]->", connectionstyle="arc3", color='#1f77b4'),
            xycoords='data',
            xytext=(-1.6921283813438717, 14.904251123120897),
            color='#1f77b4',
            ha='center',
            va='bottom',
            bbox=dict(boxstyle="rarrow,pad=0.3",
                      fc="lightblue", ec="steelblue", lw=2),
            transform_rotates_text=True, rotation=6.47724215379907, rotation_mode='anchor'
            )

plt.show()
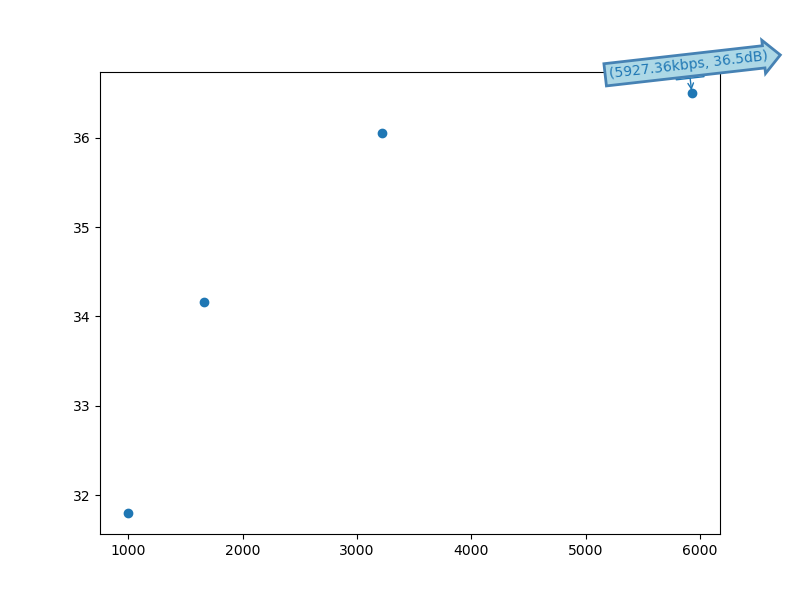
Is this the expected behavior?