I'm trying to make a shadow effect behind text boxes in a plot (similarly to
what can be done with legends).
After a fair bit of searching around I found the matplotlib.patches.Shadow
class which seems to be good for this. But I cannot get it to work properly.
I suspect it has something to do with different transforms being used for
the text itself and the actual bbox that surrounds it. This is what I have
tried:
import numpy as n
import pylab as p
import matplotlib.patches as pt
This seems to produce nothing at all (or maybe something that is far outside
the axis limits).
Am I missing something obvious here? Is there some other method that will do
this in an easier way?
This is generally a very difficult thing to do, as the position and
the extent of the text is determined when the figure is drawn.
The best way, I guess, is to create a customized Text class, but I do
not recommend this unless you're familiar with matplotlib internals.
If you're using svn version, you can use patheffect.
Otherwise, the easiest workaround is calling "draw" twice (or
"savefig" twice). But, getting this right is a bit tricky. For your
example, adding another "p.draw()" right after "p.text" will work.
Also note that your current code has some issues with zorder,
facecolor of the shadow and too small shadow offsets.
-JJ
···
On Tue, Jan 19, 2010 at 7:11 AM, Jens_M <[email protected]...> wrote:
I'm trying to make a shadow effect behind text boxes in a plot (similarly to
what can be done with legends).
After a fair bit of searching around I found the matplotlib.patches.Shadow
class which seems to be good for this. But I cannot get it to work properly.
I suspect it has something to do with different transforms being used for
the text itself and the actual bbox that surrounds it. This is what I have
tried:
import numpy as n
import pylab as p
import matplotlib.patches as pt
This seems to produce nothing at all (or maybe something that is far outside
the axis limits).
Am I missing something obvious here? Is there some other method that will do
this in an easier way?
------------------------------------------------------------------------------
Throughout its 18-year history, RSA Conference consistently attracts the
world's best and brightest in the field, creating opportunities for Conference
attendees to learn about information security's most important issues through
interactions with peers, luminaries and emerging and established companies. http://p.sf.net/sfu/rsaconf-dev2dev
_______________________________________________
Matplotlib-users mailing list [email protected] matplotlib-users List Signup and Options
JJ -- what do you think about adding a "shadow" kwarg to the bbox
props -- an extra kwarg much like "pad"? Shouldn't be too hard to
implement in the text class. Or are there some dangerous curves I'm
overlooking?
JDH
···
On Tue, Jan 19, 2010 at 4:34 PM, Jae-Joon Lee <[email protected]...> wrote:
This is generally a very difficult thing to do, as the position and
the extent of the text is determined when the figure is drawn.
The best way, I guess, is to create a customized Text class, but I do
not recommend this unless you're familiar with matplotlib internals.
Using the patheffect in the svn, shadows can be easily supported in
all the patch-like classes, including the patch of the texts. (For
example, see the last example in patheffect_demo.py). So, it should be
straight forward and I don't see any harm in doing that.
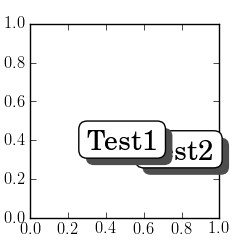
However, I personally prefer to have shadow patches as a separate
artists, so that the zorder of the shadows can be respected. For
example, in the attached example, I want the shadow of "Text 1" does
not block the text "Test 2". But doing this is not straight forward
and the code of Text class need to be further modified. I'll take a
look later.
On Tue, Jan 19, 2010 at 9:47 PM, John Hunter <[email protected]...> wrote:
On Tue, Jan 19, 2010 at 4:34 PM, Jae-Joon Lee <[email protected]...> wrote:
This is generally a very difficult thing to do, as the position and
the extent of the text is determined when the figure is drawn.
The best way, I guess, is to create a customized Text class, but I do
not recommend this unless you're familiar with matplotlib internals.
JJ -- what do you think about adding a "shadow" kwarg to the bbox
props -- an extra kwarg much like "pad"? Shouldn't be too hard to
implement in the text class. Or are there some dangerous curves I'm
overlooking?
Hi all,
I am trying to figure out how to increase the size of the numbers that label the tick marks on the axes.
Increasing the size of the axis labels is easy, use xlabel and the option fontsize = #
How do I make the numbers labelling the ticks bigger? I dont specify the ticks by hand, they are chosen automatically.
Hi all,
I am making a plot with circle symbols, so I have 'o' in the plot() command.
How do I make those circles transparent? I'd like the center of the circles to allow the catter plot underneath the circle location to show through.
In your plot() command you can set the alpha value. Try setting
mfc='b', for example, (marker face color = blue) and then alpha = .3.
and then you can try different values of alpha to see how transparent
you want it.
Che
···
On Fri, Jan 22, 2010 at 2:34 PM, Michael Cohen <[email protected]...> wrote:
Hi all,
I am making a plot with circle symbols, so I have 'o' in the plot() command.
How do I make those circles transparent? I'd like the center of the
circles to allow the catter plot underneath the circle location to show
through.
Hi all,
I am making a plot with circle symbols, so I have 'o' in the plot() command.
How do I make those circles transparent? I'd like the center of the
circles to allow the catter plot underneath the circle location to show
through.
That will make the circle borders transparent as well. If you don't want the circles filled at all, use mfc='none' (a string, not the Python None object).
Eric
···
On Fri, Jan 22, 2010 at 2:34 PM, Michael Cohen <[email protected]...> wrote:
Cheers
Michael
In your plot() command you can set the alpha value. Try setting
mfc='b', for example, (marker face color = blue) and then alpha = .3.
and then you can try different values of alpha to see how transparent
you want it.
Che
------------------------------------------------------------------------------
Throughout its 18-year history, RSA Conference consistently attracts the
world's best and brightest in the field, creating opportunities for Conference
attendees to learn about information security's most important issues through
interactions with peers, luminaries and emerging and established companies. http://p.sf.net/sfu/rsaconf-dev2dev
_______________________________________________
Matplotlib-users mailing list [email protected] matplotlib-users List Signup and Options
On Fri, Jan 22, 2010 at 2:34 PM, Michael Cohen<[email protected]...> wrote:
Hi all,
I am making a plot with circle symbols, so I have 'o' in the plot() command.
How do I make those circles transparent? I'd like the center of the
circles to allow the catter plot underneath the circle location to show
through.
That will make the circle borders transparent as well. If you don't
want the circles filled at all, use mfc='none' (a string, not the Python
None object).
Hi all,
Thanks for the help so far. One more question -
How do I completely remove the axes?
I currently have a plot where a square hatching of lines is deformed to create a sky projection, so the square block of axes actually gets in the way. How do I remove it?
On Tue, Jan 26, 2010 at 4:18 AM, Michael Cohen <[email protected]...> wrote:
Hi all,
Thanks for the help so far. One more question -
How do I completely remove the axes?
I currently have a plot where a square hatching of lines is deformed to
create a sky projection, so the square block of axes actually gets in
the way. How do I remove it?
Cheers
Michael
------------------------------------------------------------------------------
The Planet: dedicated and managed hosting, cloud storage, colocation
Stay online with enterprise data centers and the best network in the business
Choose flexible plans and management services without long-term contracts
Personal 24x7 support from experience hosting pros just a phone call away. http://p.sf.net/sfu/theplanet-com
_______________________________________________
Matplotlib-users mailing list [email protected] matplotlib-users List Signup and Options