Hi,
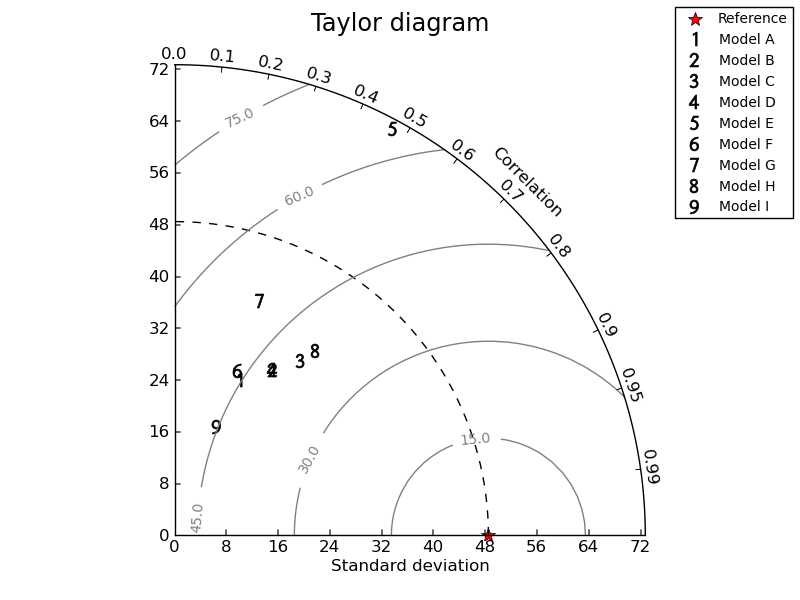
after iterating with Michael A. Rawlins over my previous attempt to code a Taylor diagram (see [1]), here's a new version of my code, along with an example plot. Maybe it could make its way into the gallery as an example of Floating Axes and Grid Finder (even though I'm not sure the code is particularly exemplary, comments are welcome).
BTW, is there a plan to "organize" the Matplotlib gallery into a more structured list of examples, e.g. with sections "Basics", "Subplots", "Axes", "Projections", "3D", "Advanced", etc. I'm getting lost sometimes with all those pretty graphics on a single page: although it makes its point at proving matplotlib is a *very* good library, this might not be very pedagogical for newbies.
Cheers,
[1] http://article.gmane.org/gmane.comp.python.matplotlib.general/25814
taylorDiagram.py (7.46 KB)
···
--
.~. Yannick COPIN (o:>* Doctus cum libro
/V\ Institut de physique nucleaire de Lyon (IN2P3 - France)
// \\ Tel: (33/0) 472 431 968 AIM: YnCopin ICQ: 236931013
/( )\ http://snovae.in2p3.fr/ycopin/
^`~'^
Hi,
after iterating with Michael A. Rawlins over my previous attempt to code
a Taylor diagram (see [1]), here's a new version of my code, along with
an example plot. Maybe it could make its way into the gallery as an
example of Floating Axes and Grid Finder (even though I'm not sure the
code is particularly exemplary, comments are welcome).
BTW, is there a plan to "organize" the Matplotlib gallery into a more
structured list of examples, e.g. with sections "Basics", "Subplots",
"Axes", "Projections", "3D", "Advanced", etc. I'm getting lost sometimes
with all those pretty graphics on a single page: although it makes its
point at proving matplotlib is a *very* good library, this might not be
very pedagogical for newbies.
Such a reorganization (ideally with some pruning and editing) has been an obvious need for a long time, but I am not aware of any plan to do it. So far, no one has volunteered.
Eric
···
On 02/21/2012 05:10 AM, Yannick Copin wrote:
Cheers,
[1] http://article.gmane.org/gmane.comp.python.matplotlib.general/25814
------------------------------------------------------------------------------
Keep Your Developer Skills Current with LearnDevNow!
The most comprehensive online learning library for Microsoft developers
is just $99.99! Visual Studio, SharePoint, SQL - plus HTML5, CSS3, MVC3,
Metro Style Apps, more. Free future releases when you subscribe now!
http://p.sf.net/sfu/learndevnow-d2d
_______________________________________________
Matplotlib-users mailing list
[email protected]
matplotlib-users List Signup and Options
Yes, I have been fiddling around with a few ideas, but nothing has materialized yet. I suspect it would involve some sort of category tagging of each example and a reworked sphinx extension to group the examples by the tags.
Yannick, that is a nice eye-catching diagram. I will see about getting it included into the gallery.
Cheers!
Ben Root
···
On Tue, Feb 21, 2012 at 12:04 PM, Eric Firing <efiring@…878…202…> wrote:
On 02/21/2012 05:10 AM, Yannick Copin wrote:
Hi,
after iterating with Michael A. Rawlins over my previous attempt to code
a Taylor diagram (see [1]), here’s a new version of my code, along with
an example plot. Maybe it could make its way into the gallery as an
example of Floating Axes and Grid Finder (even though I’m not sure the
code is particularly exemplary, comments are welcome).
BTW, is there a plan to “organize” the Matplotlib gallery into a more
structured list of examples, e.g. with sections “Basics”, “Subplots”,
“Axes”, “Projections”, “3D”, “Advanced”, etc. I’m getting lost sometimes
with all those pretty graphics on a single page: although it makes its
point at proving matplotlib is a very good library, this might not be
very pedagogical for newbies.
Such a reorganization (ideally with some pruning and editing) has been
an obvious need for a long time, but I am not aware of any plan to do
it. So far, no one has volunteered.
Eric
Good to know that someone is using axisartist toolkit.
Just a quick comment.
def add_grid(self, *args, **kwargs):
    """Add a grid."""

    self.ax.grid(*args, **kwargs)
Maybe you wanted "self._ax.grid"?
Regards,
-JJ
···
On Wed, Feb 22, 2012 at 12:10 AM, Yannick Copin <[email protected]...> wrote:
after iterating with Michael A. Rawlins over my previous attempt to code a
Taylor diagram (see [1]), here's a new version of my code, along with an
example plot. Maybe it could make its way into the gallery as an example of
Floating Axes and Grid Finder (even though I'm not sure the code is
particularly exemplary, comments are welcome).
self._ax.grid
is in the code I have.
Jae-Joon: Yannick must have modified the code beyond the version to which you refer.
Mike
···
From: Jae-Joon Lee <lee.j.joon@…287…>
To: Yannick Copin <yannick.copin@…547…>
Cc: Michael Rawlins
<rawlins@…3986…>; [email protected]
Sent: Monday, March 26, 2012 9:38 PM
Subject: Re: [Matplotlib-users] Taylor diagram (2nd take)
On Wed, Feb 22, 2012 at 12:10 AM, Yannick Copin <yannick.copin@…547…> wrote:
after iterating with Michael A. Rawlins over my previous attempt to code a
Taylor diagram (see [1]), here’s a new version of my code, along with an
example plot. Maybe it could make its way into the gallery as an example of
Floating Axes and Grid Finder (even though I’m not sure the code is
particularly exemplary, comments are welcome).
Good to know that someone is using axisartist toolkit.
Just a quick comment.
def add_grid(self, *args, **kwargs):
"""Add a grid."""
self.ax.grid(*args, **kwargs)
Maybe you wanted
“self._ax.grid”?
Regards,
-JJ
This SF email is sponsosred by:
Try Windows Azure free for 90 days Click Here
Matplotlib-users mailing list
[email protected]
https://lists.sourceforge.net/lists/listinfo/matplotlib-users