Hi I need to use the symlog yscale in my graph, I have a lot of data that needs to be displayed linearly, with a small fraction at the upper end of the range that needs to be displayed in log scale due to its distance from the main data. The symlog scale works great, however I'd like to adjust the actual vertical graph position where it crosses from linear to log (not the threshold), because right now only ~25% of the y space is being given to linear, and I'd like it to be more like 80%. Is this possible?
Thanks!
David
Isn’t linthreshy what you are looking for? It denotes the range where the scale is linear. So, if it is 25, then from -25 to 25 the scale will be linear. After 25, it will be log.
Maybe I am missing something in your description?
Cheers!
Ben Root
···
On Tue, May 1, 2012 at 6:42 AM, David Erickson <derickso@…200…> wrote:
Hi I need to use the symlog yscale in my graph, I have a lot of data
that needs to be displayed linearly, with a small fraction at the upper
end of the range that needs to be displayed in log scale due to its
distance from the main data. The symlog scale works great, however I’d
like to adjust the actual vertical graph position where it crosses from
linear to log (not the threshold), because right now only ~25% of the y
space is being given to linear, and I’d like it to be more like 80%. Is
this possible?
Thanks!
David
Hi Ben,
No unfortunately linthreshy only controls the crossover point from
linear to log scale, it does not give you control over where this
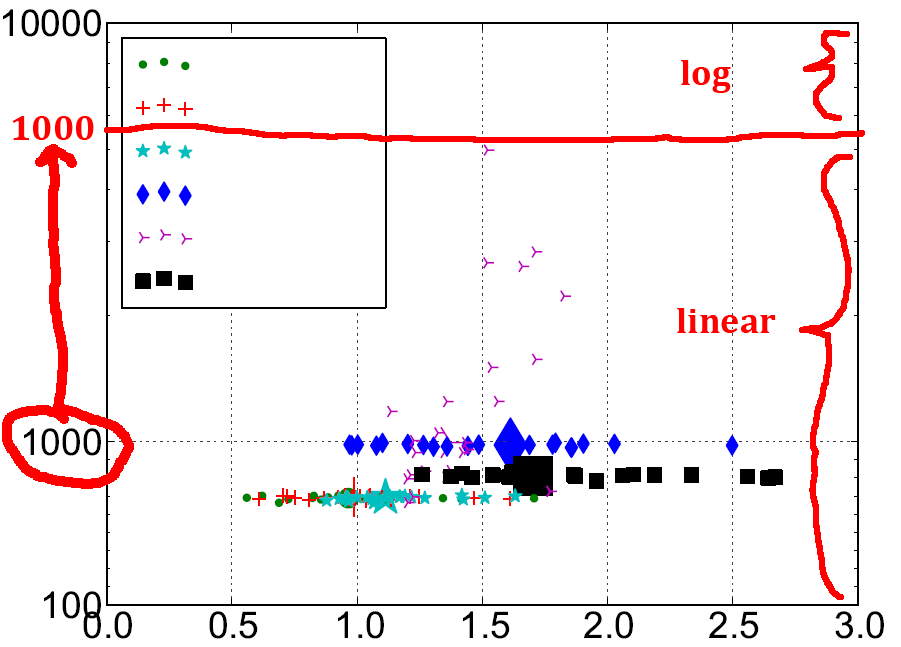
occurs on the figure’s y coordinates. I’ve attached a picture to
explain, currently the linear part of the graph is only being given
around 25% of the vertical space, I’d like to reverse that and give
linear ~75% and log at the top only the remaining 25%. Is this
possible? I’ve been digging around in the SymmetricalLogScale and
SymmetricalLogLocator classes and can’t even tell how this range is
allocated.
Thanks in advance!!

-David
···
On 5/1/2012 5:41 AM, Benjamin Root wrote:
On Tue, May 1, 2012 at 6:42 AM, David > Erickson <[email protected]...> > wrote:
Hi I need to use the symlog yscale in my graph, I have a lot
of data
that needs to be displayed linearly, with a small fraction at
the upper
end of the range that needs to be displayed in log scale due
to its
distance from the main data. The symlog scale works great,
however I’d
like to adjust the actual vertical graph position where it
crosses from
linear to log (not the threshold), because right now only ~25%
of the y
space is being given to linear, and I'd like it to be more
like 80%. Is
      this possible?


      Thanks!

      David
Isn't linthreshy what you are looking for? It denotes the
range where the scale is linear. So, if it is 25, then from
-25 to 25 the scale will be linear. After 25, it will be log.
      Maybe I am missing something in your description?


      Cheers!

      Ben Root
David,
Thanks, that is much clearer what you are looking for. You are right, I can’t seem to find any sort of obvious way to get what you want. Reading the docs for the SymLog scale indicates to me that the author intended for the logrithmic portion to be most interesting and the linear portion was only supposed to be a work-around the whole log(0) issue. Could you file an issue on the github page so that we can mark it as a feature request?
Thanks,
Ben Root
···
On Wed, May 2, 2012 at 3:59 PM, David Erickson <derickso@…200…> wrote:
On 5/1/2012 5:41 AM, Benjamin Root wrote:
On Tue, May 1, 2012 at 6:42 AM, David > > Erickson <[email protected]...> > > wrote:
Hi I need to use the symlog yscale in my graph, I have a lot
of data
that needs to be displayed linearly, with a small fraction at
the upper
end of the range that needs to be displayed in log scale due
to its
distance from the main data. The symlog scale works great,
however I’d
like to adjust the actual vertical graph position where it
crosses from
linear to log (not the threshold), because right now only ~25%
of the y
space is being given to linear, and I'd like it to be more
like 80%. Is
      this possible?


      Thanks!

      David
Isn't linthreshy what you are looking for? It denotes the
range where the scale is linear. So, if it is 25, then from
-25 to 25 the scale will be linear. After 25, it will be log.
      Maybe I am missing something in your description?


      Cheers!

      Ben Root
Hi Ben,
No unfortunately linthreshy only controls the crossover point from
linear to log scale, it does not give you control over where this
occurs on the figure’s y coordinates. I’ve attached a picture to
explain, currently the linear part of the graph is only being given
around 25% of the vertical space, I’d like to reverse that and give
linear ~75% and log at the top only the remaining 25%. Is this
possible? I’ve been digging around in the SymmetricalLogScale and
SymmetricalLogLocator classes and can’t even tell how this range is
allocated.
Thanks in advance!!

-David
Just getting to this after some unexpected absences. Yes – that is
how symlog was originally intended, so there isn’t currently any way
to configure it. Please file the issue and assign it to me. I’ll
have a look at what needs to be added to support this.
Mike
···
On 05/03/2012 09:48 AM, Benjamin Root wrote:
On Wed, May 2, 2012 at 3:59 PM, David > Erickson <[email protected]...> > wrote:
On 5/1/2012 5:41 AM, Benjamin Root wrote:
On Tue, May 1, 2012 at 6:42 > > > AM, David Erickson <[email protected]...> > > > wrote:
Hi I need to use the symlog yscale in my graph, I
have a lot of data
that needs to be displayed linearly, with a small
fraction at the upper
end of the range that needs to be displayed in log
scale due to its
distance from the main data. The symlog scale
works great, however I’d
like to adjust the actual vertical graph position
where it crosses from
linear to log (not the threshold), because right
now only ~25% of the y
space is being given to linear, and I'd like it to
be more like 80%. Is
                  this possible?


                  Thanks!

                  David
Isn't linthreshy what you are looking for? It
denotes the range where the scale is linear. So,
if it is 25, then from -25 to 25 the scale will be
linear. After 25, it will be log.
                  Maybe I am missing something in your description?


                  Cheers!

                  Ben Root
Hi Ben,
No unfortunately linthreshy only controls the crossover
point from linear to log scale, it does not give you control
over where this occurs on the figure’s y coordinates. I’ve
attached a picture to explain, currently the linear part of
the graph is only being given around 25% of the vertical
space, I’d like to reverse that and give linear ~75% and log
at the top only the remaining 25%. Is this possible? I’ve
been digging around in the SymmetricalLogScale and
SymmetricalLogLocator classes and can’t even tell how this
range is allocated.
        Thanks in advance!!

            -David
  David,


  Thanks, that is much clearer what you are looking for.  You are
right, I can’t seem to find any sort of obvious way to get what
you want. Reading the docs for the SymLog scale indicates to me
that the author intended for the logrithmic portion to be most
interesting and the linear portion was only supposed to be a
work-around the whole log(0) issue. Could you file an issue on
the github page so that we can mark it as a feature request?