Dear matplolibers,
when dealing with multi-axes plot sometimes would be nice to use figure-wide x and y labels.
On the web I’ve found some suggestion on how to do this, but I found no solution valid in the general case and that integrate in the matplotlib ecosystem.
The ideal would be to have a “set_xlabel” and “set_ylabel” method in the Figure class, with the same api of the corresponding Axes methods.
As a proof of concept I’ve written a class derived from Figure , which implements the two methods simply adding a horizontal (vertical) text below (left of) the lowest (leftmost) axes.
The class together with a short example is attached.
I’m aware that the current implementation is really poor (no integration with tight_layout, the padding must be adjusted by hand, a problem in particular for the y label).
The best is to use “self.xaxis.set_label_text(xlabel, fontdict, **kwargs)” as in the Axis set_xlabel (as I gather this create a label that is rendered in the correct position accounting for ticklabels, ticks, tight_layout, etc). To do this one would have to create:
- a figure-wide invisible axes that encloses all the other axes/subplots, and whose dimension has to be updated every time a new axis/subplot is added (this should be easily done) with only the label visible. This could also allow to use axis features, like twin axis.
- just the required axis (invisible) that hosts the labels. I think that this approach is less demanding computationally, but I don’t know how much sense have two axis not attached to axes.
Any suggestions/hints on how to implement these methods in a better way is very welcome.
If there is no opposition, later in the day I’ll submit PR on github with the two new method and see if we can get something out of this idea.
Cheers,
Francesco
test_set_label_fig.py (3 KB)
I am not exactly sure if this is the same as what you are thinking, but the axes objects have a “label_outer()” method that would turn on and off the visibility of various axis components based on their location in a subplot grid. You call it for each axes in a subplot grid.
Cheers!
Ben Root
···
On Tue, Nov 13, 2012 at 6:16 AM, Francesco Montesano <franz.bergesund@…287…> wrote:
Dear matplolibers,
when dealing with multi-axes plot sometimes would be nice to use figure-wide x and y labels.
On the web I’ve found some suggestion on how to do this, but I found no solution valid in the general case and that integrate in the matplotlib ecosystem.
The ideal would be to have a “set_xlabel” and “set_ylabel” method in the Figure class, with the same api of the corresponding Axes methods.
As a proof of concept I’ve written a class derived from Figure , which implements the two methods simply adding a horizontal (vertical) text below (left of) the lowest (leftmost) axes.
The class together with a short example is attached.
I’m aware that the current implementation is really poor (no integration with tight_layout, the padding must be adjusted by hand, a problem in particular for the y label).
The best is to use “self.xaxis.set_label_text(xlabel, fontdict, **kwargs)” as in the Axis set_xlabel (as I gather this create a label that is rendered in the correct position accounting for ticklabels, ticks, tight_layout, etc). To do this one would have to create:
- a figure-wide invisible axes that encloses all the other axes/subplots, and whose dimension has to be updated every time a new axis/subplot is added (this should be easily done) with only the label visible. This could also allow to use axis features, like twin axis.
- just the required axis (invisible) that hosts the labels. I think that this approach is less demanding computationally, but I don’t know how much sense have two axis not attached to axes.
Any suggestions/hints on how to implement these methods in a better way is very welcome.
If there is no opposition, later in the day I’ll submit PR on github with the two new method and see if we can get something out of this idea.
Cheers,
Francesco
2012/11/13 Benjamin Root <[email protected]...>
Dear matplolibers,
when dealing with multi-axes plot sometimes would be nice to use
figure-wide x and y labels.
On the web I've found some suggestion on how to do this, but I found
no solution valid in the general case and that integrate in the
matplotlib ecosystem.
The ideal would be to have a "set_xlabel" and "set_ylabel" method in the
Figure class, with the same api of the corresponding Axes methods.
As a proof of concept I've written a class derived from Figure , which
implements the two methods simply adding a horizontal (vertical) text below
(left of) the lowest (leftmost) axes.
The class together with a short example is attached.
I'm aware that the current implementation is really poor (no integration
with tight_layout, the padding must be adjusted by hand, a problem in
particular for the y label).
The best is to use "self.xaxis.set_label_text(xlabel, fontdict,
**kwargs)" as in the Axis set_xlabel (as I gather this create a label that
is rendered in the correct position accounting for ticklabels, ticks,
tight_layout, etc). To do this one would have to create:
- a figure-wide invisible axes that encloses all the other
axes/subplots, and whose dimension has to be updated every time a new
axis/subplot is added (this should be easily done) with only the label
visible. This could also allow to use axis features, like twin axis.
- just the required axis (invisible) that hosts the labels. I think
that this approach is less demanding computationally, but I don't know how
much sense have two axis not attached to axes.
Any suggestions/hints on how to implement these methods in a better way
is very welcome.
If there is no opposition, later in the day I'll submit PR on github with
the two new method and see if we can get something out of this idea.
Cheers,
Francesco
I am not exactly sure if this is the same as what you are thinking, but
the axes objects have a "label_outer()" method that would turn on and off
the visibility of various axis components based on their location in a
subplot grid. You call it for each axes in a subplot grid.
Cheers!
Ben Root
Hi Ben,
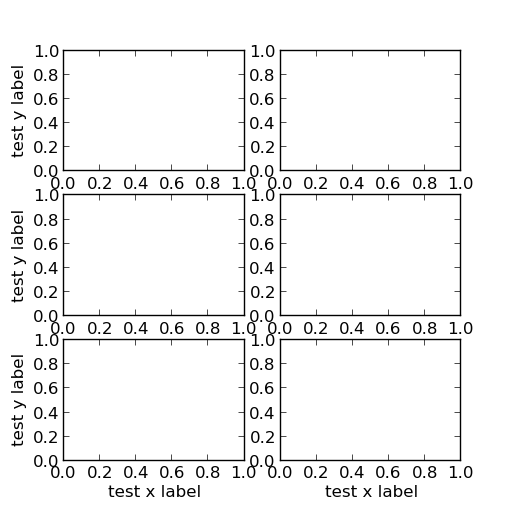
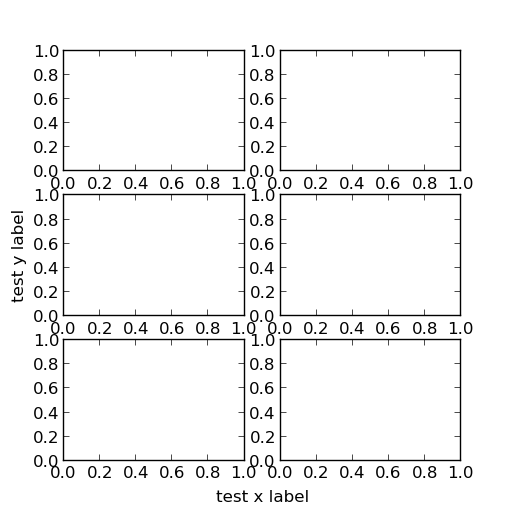
sorry that I'm not being clear. My scope is to have the a unique x and y
label as in "figure_label.png" instead a x and y label for each outer axes
as in "axes_label.png".
This could be done not writing axes labels and then using a simple text on
the left and bottom, but I think that set_[xy]label method in class Figure
(as the method legend) is much neater.
Besides can improve readability of plots with lots of panels showing the
same quantities.
Is it clearer now?
Francesco
···
On Tue, Nov 13, 2012 at 6:16 AM, Francesco Montesano < > [email protected]...> wrote: