Hi
Whenever I create figures with at least 3x3 subplots, the x-tick
labels overlap with each other and they also overlap with the title of
the adjacent subplot, rendering the entire figure illegible. I know
that I can fine-tune the plot to look exactly the way I want with
"wspace" and "hspace" for instance, but I don't understand why this is
the default behavior. I wonder if I have a system font issue, such
that matplotlib thinks the fonts are smaller than they really are.
My questions:
1) Is this the intended behavior of matplotlib, or is there something
wrong with my installation?
2) Assuming I don't have an installation issue, is there a very
general parameter I can change so that the overlap doesn't occur,
rather than manually adjusting every figure?
Minimal code to reproduce the problem:
import numpy as np
import matplotlib.pyplot as plt
plt.figure()
plt.subplot(331)
plt.subplot(334)
plt.plot(np.arange(10000))
plt.title('Title')
plt.show()
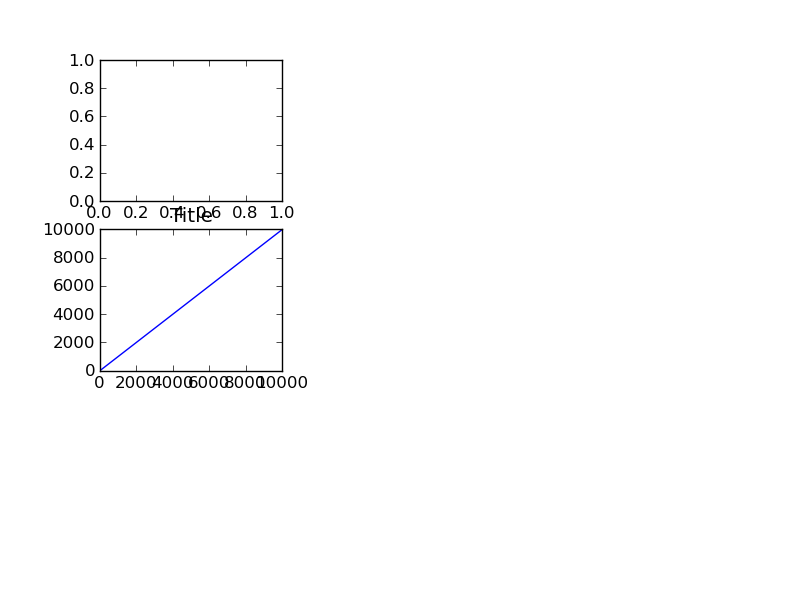
I'm attaching the output figure, although I'm not sure if the list
accepts attachments. The x-tick labels on subplot 334 overlap each
other, and the title of subplot 334 overlaps with the x-tick labels in
subplot 331.
System:
Ubuntu 10.04 x64
All packages are the stable versions from Synaptic, including ipython,
python, numpy, matplotlib 0.99.1.1
I've also tried the Enthought distribution with matplotlib 1.0.1 and
the results are the same
I've tried both "Wx" and "Tk" backends and the results are the same
I've tried `matplotlib.rcParams['xtick.labelsize'] = 'x-small'`, and
this does make the labels smaller, but for sufficiently large numbers
the overlap still occurs.
Thanks for any help!
Chris