Whenever I create figures with at least 3x3 subplots, the x-tick
labels overlap with each other and they also overlap with the title of
the adjacent subplot, rendering the entire figure illegible. I know
that I can fine-tune the plot to look exactly the way I want with
"wspace" and "hspace" for instance, but I don't understand why this is
the default behavior. I wonder if I have a system font issue, such
that matplotlib thinks the fonts are smaller than they really are.
My questions:
1) Is this the intended behavior of matplotlib, or is there something
wrong with my installation?
2) Assuming I don't have an installation issue, is there a very
general parameter I can change so that the overlap doesn't occur,
rather than manually adjusting every figure?
Minimal code to reproduce the problem:
import numpy as np
import matplotlib.pyplot as plt
plt.figure()
plt.subplot(331)
plt.subplot(334)
plt.plot(np.arange(10000))
plt.title('Title')
plt.show()
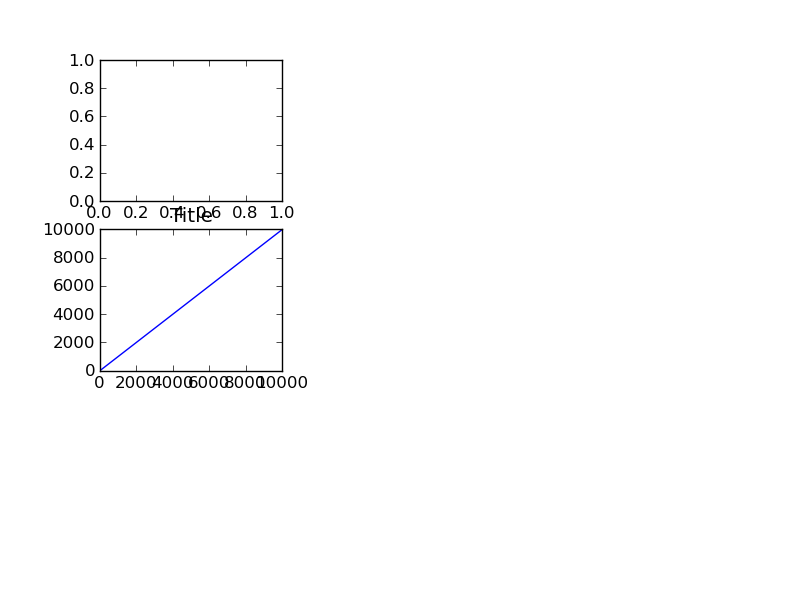
I'm attaching the output figure, although I'm not sure if the list
accepts attachments. The x-tick labels on subplot 334 overlap each
other, and the title of subplot 334 overlaps with the x-tick labels in
subplot 331.
System:
Ubuntu 10.04 x64
All packages are the stable versions from Synaptic, including ipython,
python, numpy, matplotlib 0.99.1.1
I've also tried the Enthought distribution with matplotlib 1.0.1 and
the results are the same
I've tried both "Wx" and "Tk" backends and the results are the same
I've tried `matplotlib.rcParams['xtick.labelsize'] = 'x-small'`, and
this does make the labels smaller, but for sufficiently large numbers
the overlap still occurs.
I have been wondering the same thing. Matlab is able to prevent labels from
overlapping each other. Why can't matplotlib?
Chris Rodgers-7 wrote:
···
Hi
Whenever I create figures with at least 3x3 subplots, the x-tick
labels overlap with each other and they also overlap with the title of
the adjacent subplot, rendering the entire figure illegible. I know
that I can fine-tune the plot to look exactly the way I want with
"wspace" and "hspace" for instance, but I don't understand why this is
the default behavior. I wonder if I have a system font issue, such
that matplotlib thinks the fonts are smaller than they really are.
My questions:
1) Is this the intended behavior of matplotlib, or is there something
wrong with my installation?
2) Assuming I don't have an installation issue, is there a very
general parameter I can change so that the overlap doesn't occur,
rather than manually adjusting every figure?
Minimal code to reproduce the problem:
import numpy as np
import matplotlib.pyplot as plt
plt.figure()
plt.subplot(331)
plt.subplot(334)
plt.plot(np.arange(10000))
plt.title('Title')
plt.show()
I'm attaching the output figure, although I'm not sure if the list
accepts attachments. The x-tick labels on subplot 334 overlap each
other, and the title of subplot 334 overlaps with the x-tick labels in
subplot 331.
System:
Ubuntu 10.04 x64
All packages are the stable versions from Synaptic, including ipython,
python, numpy, matplotlib 0.99.1.1
I've also tried the Enthought distribution with matplotlib 1.0.1 and
the results are the same
I've tried both "Wx" and "Tk" backends and the results are the same
I've tried `matplotlib.rcParams['xtick.labelsize'] = 'x-small'`, and
this does make the labels smaller, but for sufficiently large numbers
the overlap still occurs.
Thanks for any help!
Chris
------------------------------------------------------------------------------
WhatsUp Gold - Download Free Network Management Software
The most intuitive, comprehensive, and cost-effective network
management toolset available today. Delivers lowest initial
acquisition cost and overall TCO of any competing solution. http://p.sf.net/sfu/whatsupgold-sd
_______________________________________________
Matplotlib-users mailing list [email protected] matplotlib-users List Signup and Options
it still makes the labels too close to read, even if they don't overlap.
that is, they're just a continuous string of numbers with no whitespace
between.
it does clean up the rest of the plot really nicely, though, without having
to continually dick around with subplots_adjust
Tony Yu-3 wrote:
···
On Wed, Jan 4, 2012 at 1:14 PM, jeffsp <[email protected]...> wrote:
I have been wondering the same thing. Matlab is able to prevent labels
from
overlapping each other. Why can't matplotlib?
Chris Rodgers-7 wrote:
>
> Hi
>
> Whenever I create figures with at least 3x3 subplots, the x-tick
> labels overlap with each other and they also overlap with the title of
> the adjacent subplot, rendering the entire figure illegible. I know
> that I can fine-tune the plot to look exactly the way I want with
> "wspace" and "hspace" for instance, but I don't understand why this is
> the default behavior. I wonder if I have a system font issue, such
> that matplotlib thinks the fonts are smaller than they really are.
>
> My questions:
> 1) Is this the intended behavior of matplotlib, or is there something
> wrong with my installation?
> 2) Assuming I don't have an installation issue, is there a very
> general parameter I can change so that the overlap doesn't occur,
> rather than manually adjusting every figure?
>
>
> Minimal code to reproduce the problem:
>
> import numpy as np
> import matplotlib.pyplot as plt
> plt.figure()
> plt.subplot(331)
> plt.subplot(334)
> plt.plot(np.arange(10000))
> plt.title('Title')
> plt.show()
>
>
> I'm attaching the output figure, although I'm not sure if the list
> accepts attachments. The x-tick labels on subplot 334 overlap each
> other, and the title of subplot 334 overlaps with the x-tick labels in
> subplot 331.
Have you try calling `plt.tight_layout()` right before `plt.show()`?
-Tony
>
> System:
> Ubuntu 10.04 x64
> All packages are the stable versions from Synaptic, including ipython,
> python, numpy, matplotlib 0.99.1.1
> I've also tried the Enthought distribution with matplotlib 1.0.1 and
> the results are the same
> I've tried both "Wx" and "Tk" backends and the results are the same
> I've tried `matplotlib.rcParams['xtick.labelsize'] = 'x-small'`, and
> this does make the labels smaller, but for sufficiently large numbers
> the overlap still occurs.
>
> Thanks for any help!
> Chris
------------------------------------------------------------------------------
Ridiculously easy VDI. With Citrix VDI-in-a-Box, you don't need a complex
infrastructure or vast IT resources to deliver seamless, secure access to
virtual desktops. With this all-in-one solution, easily deploy virtual
desktops for less than the cost of PCs and save 60% on VDI infrastructure
costs. Try it free! http://p.sf.net/sfu/Citrix-VDIinabox
_______________________________________________
Matplotlib-users mailing list [email protected] matplotlib-users List Signup and Options
Well, it is a new feature with plenty of room for improvements. Maybe some sort of mindist parameter would be useful to establish a minimum distance between text objects?
Ben Root
···
On Wednesday, January 4, 2012, jeffsp <jeffsp@…287…> wrote:
plt.tight_layout(), sweet
it still makes the labels too close to read, even if they don’t overlap.
that is, they’re just a continuous string of numbers with no whitespace
between.
it does clean up the rest of the plot really nicely, though, without having
to continually dick around with subplots_adjust
Something like that sounds good. If there were a way to make it the default that labels would never overlap (but that default could be toggled for those who, somehow, want to not be able to read their labels?), that strikes me as best.
In the meantime, what are other ways to do this?
···
On Wed, Jan 4, 2012 at 2:19 PM, Benjamin Root <ben.root@…1304…> wrote:
On Wednesday, January 4, 2012, jeffsp <jeffsp@…287…> wrote:
plt.tight_layout(), sweet
it still makes the labels too close to read, even if they don’t overlap.
that is, they’re just a continuous string of numbers with no whitespace
between.
it does clean up the rest of the plot really nicely, though, without having
to continually dick around with subplots_adjust
Well, it is a new feature with plenty of room for improvements. Maybe some sort of mindist parameter would be useful to establish a minimum distance between text objects?
Just to clarify, I don’t think improvements to tight_layout will fix your issues with tick layout; tight_layout adjusts the subplot spacing, not the spacing of tick labels.
If you just want to prevent overlap in the static case, you can just set the tick labels yourself, e.g. plt.xticks([1, 2, 3]). If you want something automatic and dynamic, …
I believe this is actually a pretty difficult problem to solve in the general case. I’ve implemented a hacky attempt here, but it leaves out a lot of common use cases (e.g. subplots) and doesn’t account for spacing between the axes and figure.
-Tony
···
On Sun, Jan 29, 2012 at 10:10 PM, C M <cmpython@…1896…> wrote:
On Wed, Jan 4, 2012 at 2:19 PM, Benjamin Root <ben.root@…1304…> wrote:
On Wednesday, January 4, 2012, jeffsp <jeffsp@…287…> wrote:
plt.tight_layout(), sweet
it still makes the labels too close to read, even if they don’t overlap.
that is, they’re just a continuous string of numbers with no whitespace
between.
it does clean up the rest of the plot really nicely, though, without having
to continually dick around with subplots_adjust
Well, it is a new feature with plenty of room for improvements. Maybe some sort of mindist parameter would be useful to establish a minimum distance between text objects?
Ben Root
Something like that sounds good. If there were a way to make it the default that labels would never overlap (but that default could be toggled for those who, somehow, want to not be able to read their labels?), that strikes me as best.