Hi All,
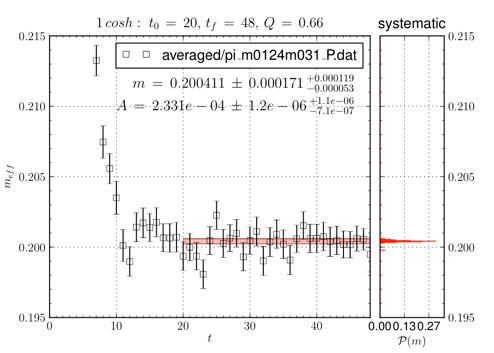
I am trying to create a subplot - where a specific subcell looks like the attached sample_fig.png
To make this fig, I did something like
ax1 = plt.axes([0.1,0.1,0.65,0.8])
ax2 = plt.axes([0.77,0.1,0.13,0.8])
and then I loaded my data and fit curves onto the separate figs.
Now I am trying to create something like this, but where this fig is only one cell of a subplot. But I can't figure this one out, at least not yet, and haven't found a similar enough example.
Is there a way to manipulate the equivalent of the axes in a subplot to mimic this figure?
Thanks,
Andre