Hi,
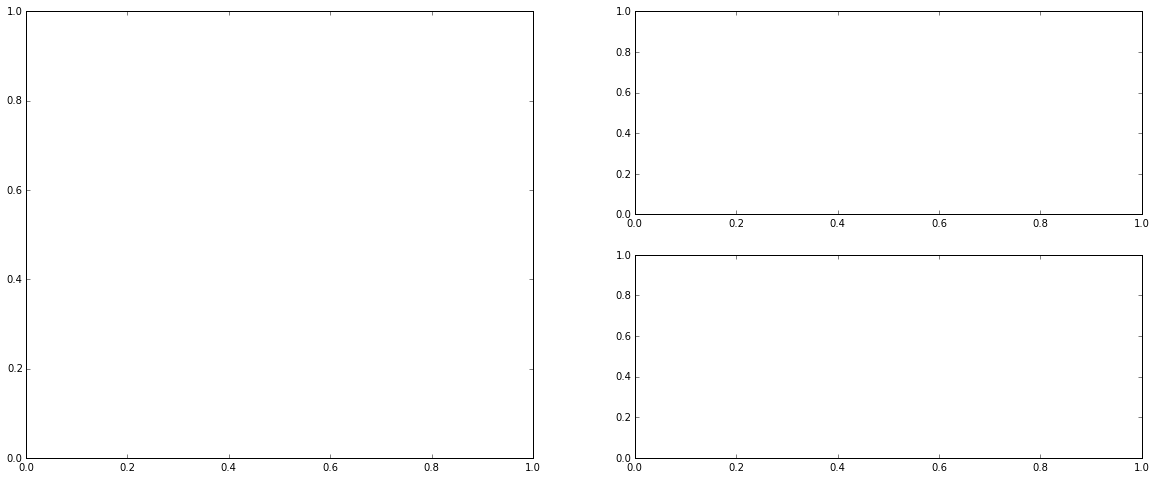
I am looking for a layout as seen in the empty layout attached which is produced using
figsize(20,8),subplot(1,2,1);subplot(222);subplot(224)
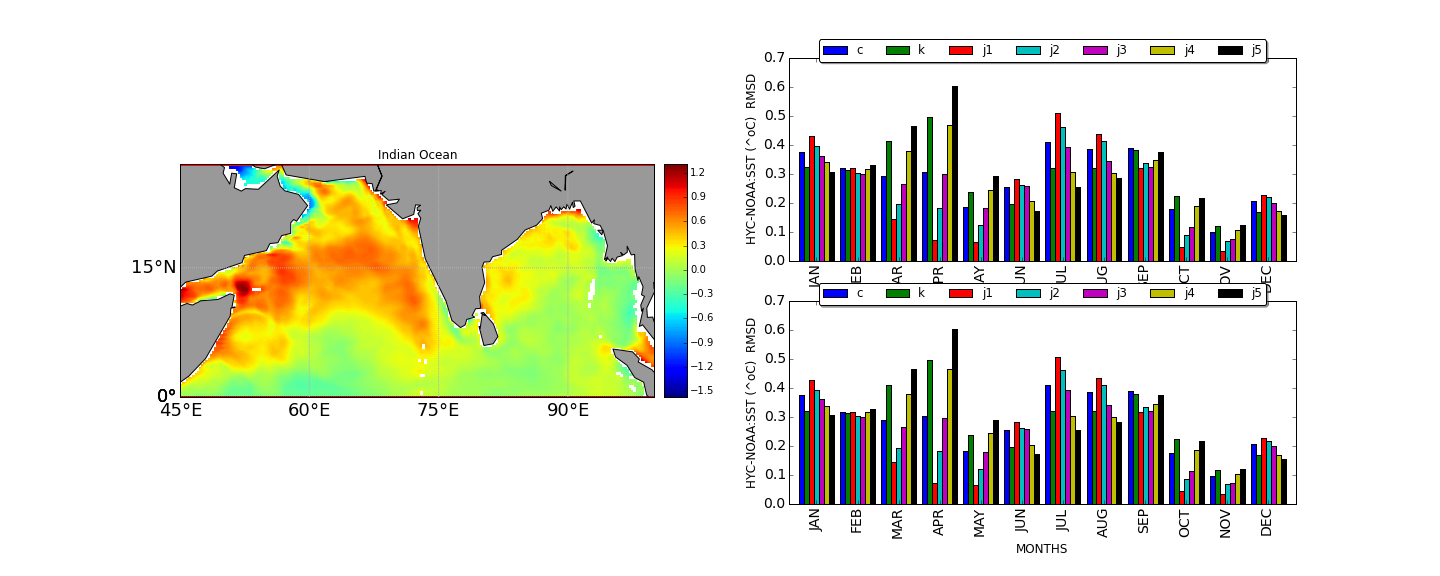
However when I use it for getting attached second figure the layout gets modified as seen in attached figure 2.
fig = p.figure(figsize=(20,8))
ax=p.subplot(121)
ax1=p.subplot(222)
ax2=p.subplot(224)
Can any one suggest a way to get figure exactly as the empty layout?
With best regards,
Sudheer
*************************************************************** Sudheer Joseph Indian National Centre for Ocean Information Services Ministry of Earth Sciences, Govt. of India POST BOX NO: 21, IDA Jeedeemetla P.O. Via Pragathi Nagar,Kukatpally, Hyderabad; Pin:5000 55 Tel:+91-40-23886047(O),Fax:+91-40-23895011(O), Tel:+91-40-23044600(R),Tel:+91-40-9440832534(Mobile) E-mail:[email protected]...;[email protected]... Web- http://oppamthadathil.tripod.com ***************************************************************
Yes, the left hand axis is shrinking in the vertical because it is applying the aspect ratio appropriate for 15 N and the N/S extent of your data. Either make the N/S extent of the map larger; make the left hand column wider; or make the figure shorter.
Cheers, Jody
···
On 25 Apr 2016, at 9:05 AM, Sudheer Joseph <[email protected]...> wrote:
Hi,
I am looking for a layout as seen in the empty layout attached which is produced using
figsize(20,8),subplot(1,2,1);subplot(222);subplot(224)
However when I use it for getting attached second figure the layout gets modified as seen in attached figure 2.
fig = p.figure(figsize=(20,8))
ax=p.subplot(121)
ax1=p.subplot(222)
ax2=p.subplot(224)
Can any one suggest a way to get figure exactly as the empty layout?
With best regards,
Sudheer
*************************************************************** Sudheer Joseph Indian National Centre for Ocean Information Services Ministry of Earth Sciences, Govt. of India POST BOX NO: 21, IDA Jeedeemetla P.O. Via Pragathi Nagar,Kukatpally, Hyderabad; Pin:5000 55 Tel:+91-40-23886047(O),Fax:+91-40-23895011(O), Tel:+91-40-23044600(R),Tel:+91-40-9440832534(Mobile) E-mail:[email protected]...;[email protected]... Web- http://oppamthadathil.tripod.com ***************************************************************<req_layout.png><getting_layout.png>------------------------------------------------------------------------------
Find and fix application performance issues faster with Applications Manager
Applications Manager provides deep performance insights into multiple tiers of
your business applications. It resolves application problems quickly and
reduces your MTTR. Get your free trial! https://ad.doubleclick.net/ddm/clk/302982198;130105516;z_______________________________________________
Matplotlib-users mailing list [email protected] matplotlib-users List Signup and Options
Your basemap plot is likely setting the aspect of the axes to “equal”, so it resizes the plot accordingly. Otherwise you’d have a pretty nasty amount of vertical distortion.
When you save the figure, using bbox_inches=‘tight’ will trim the excess white space from the margins:
However when I use it for getting attached second figure the layout gets modified as seen in attached figure 2.
fig = p.figure(figsize=(20,8))
ax=p.subplot(121)
ax1=p.subplot(222)
ax2=p.subplot(224)
Can any one suggest a way to get figure exactly as the empty layout?
With best regards,
Sudheer
*************************************************************** Sudheer Joseph Indian National Centre for Ocean Information Services Ministry of Earth Sciences, Govt. of India POST BOX NO: 21, IDA Jeedeemetla P.O. Via Pragathi Nagar,Kukatpally, Hyderabad; Pin:5000 55 Tel:+91-40-23886047(O),Fax:+91-40-23895011(O), Tel:+91-40-23044600(R),Tel:+91-40-9440832534(Mobile) E-mail:sjo.India@…287…;sudheer.joseph@…9… Web- http://oppamthadathil.tripod.com ***************************************************************
Find and fix application performance issues faster with Applications Manager
Applications Manager provides deep performance insights into multiple tiers of
your business applications. It resolves application problems quickly and