Subfigure legend disappearing beyond window/frame despite tight_layout

I’m using below code to create a visual of a chart with 2 subplots and a table directly below. It’s working fine like this. However, I would like to increase the space between the legend at the top and the chart. I’m doing that using an increase of the y parameter in bbox_to_anchor (5th line from the bottom). With a value of 1.1 it’s still fine, but with 1.2 it disappears outside the frame.
Does anybody know how to fix that?

import pandas as pd
import matplotlib
import matplotlib.pyplot as plt
import seaborn as sns

labels = ['abc','def','ghi','jkl','mno']
actual = [36,35,41,36,33]
target = [31,39,32,37,37]

data_dict_people = {'Labels':labels,'Actual':actual,'Target':target}
df_people_nps_graph = pd.DataFrame(data = data_dict_people)

index_labels = ['a', 'b', 'c', 'd', 'e']
nps_data_table = [[81,85,77,87,82],[89,89,90,89,89],[93,91,94,99,94],[85,86,86,86,86],[81,87,96,90,91]]
df_people_nps_table = pd.DataFrame(data = nps_data_table, columns=labels, index=index_labels)

nps_colors = []
for i in range(0,len(nps_data_table)):
    nps_colors.append(['#000000']*len(nps_data_table[0]))

matplotlib.rc_file_defaults()
sns.set_theme(style="ticks", 
                context="talk", 
                rc={'axes.facecolor':'#0E1117', 
                'figure.facecolor':'#0E1117', 
                'text.color':'white',
                'font.size':14,
                'axes.labelcolor':'white',
                'xtick.color': 'white'})

fig = plt.figure(constrained_layout = True)
subfigs = fig.subfigures(2,1, height_ratios=[1,1], hspace=0)

ax1 = subfigs[0].subplots(1,1,sharey=True)
bp = sns.barplot(data = df_people_nps_graph, x='Labels', y='Actual', alpha=0.8, ax=ax1, color='grey', label='Actual') 
lp = sns.lineplot(data = df_people_nps_graph['Target'], marker='o', sort = False, ax=ax1, alpha=0.8, color='green', linewidth=7, label='Target')

ax2 = subfigs[1].subplots()
p_table = ax2.table(cellText = df_people_nps_table.values, rowLabels=df_people_nps_table.index, colLabels=df_people_nps_table.columns, bbox=[0, 0, 1, 1], cellColours=nps_colors, rowColours=['#000000']*len(nps_data_table), colColours=['#000000']*len(nps_data_table[0]), edges='horizontal')
p_table.set_fontsize(12)

ax1.grid(False)
ax1.set(ylim=(0,df_people_nps_graph['Actual'].max()*1.2),
        xlabel=None, 
        yticklabels=[], 
        xticks=[], 
        ylabel=None) # xticklabels(labels=df_people_nps_graph['Labels'] ,rotation=45)
ax1.bar_label(ax1.containers[0])
ax1.margins(x=0.02) # shift a bit horizontally for alignment
ax1.legend(loc='upper center', ncol=len(df_people_nps_graph.columns), fontsize=14, frameon=False, bbox_to_anchor=(0.5, 1.2)) # bbox allows placing legend outside of figure
sns.despine(left=True)
plt.tight_layout()
plt.axis('off')
plt.show()
You have already enabled constrained layout; there’s no need to call tight_layout, and in fact it turns it off. Remove the plt.tight_layout() call and constrained layout works and the legend is visible.

1 Like

Thanks! that fixed it.

I’ve been able to progress on my chart and aligned the columns of the below figure with the bar chart above. There still seems to be some weird interaction between turning off the axis and the fontsize. As soon as I add ax3.axis(‘off’), the font size becomes very small, despite manually setting it with h_table.set_fontsize(12) . Any clue why this is happening?

import pandas as pd
import matplotlib
import matplotlib.pyplot as plt
import seaborn as sns

labels = ['abc','def','ghi','jkl','mno']
actual = [36,35,41,36,33]
target = [31,39,32,37,37]

data_dict_people = {'Labels':labels,'Actual':actual,'Target':target}
df_people_nps_graph = pd.DataFrame(data = data_dict_people)

index_labels = ['a', 'b', 'c', 'd', 'e']
nps_data_table = [[81,85,77,87,82],[89,89,90,89,89],[93,91,94,99,94],[85,86,86,86,86],[81,87,96,90,91]]
df_people_nps_table = pd.DataFrame(data = nps_data_table, columns=labels, index=index_labels)

nps_colors = []
for i in range(0,len(nps_data_table)):
    nps_colors.append(['#000000']*len(nps_data_table[0]))

matplotlib.rc_file_defaults()
sns.set_theme(style="ticks", 
                context="talk", 
                rc={'axes.facecolor':'#0E1117', 
                'figure.facecolor':'#0E1117', 
                'text.color':'white',
                'font.size':14,
                'axes.labelcolor':'white',
                'xtick.color': 'white'})

fig = plt.figure(constrained_layout = True)
subfigs = fig.subfigures(2,2, height_ratios=[1,1], hspace=0, width_ratios=[1,10])

ax1 = subfigs[0][1].subplots(1,1,sharey=True)
bp = sns.barplot(data = df_people_nps_graph, x='Labels', y='Actual', alpha=0.8, ax=ax1, color='grey', label='Actual') 
lp = sns.lineplot(data = df_people_nps_graph['Target'], marker='o', sort = False, ax=ax1, alpha=0.8, color='green', linewidth=7, label='Target')

ax3 = subfigs[1][0].subplots()
h_table = ax3.table(cellText = [[i] for i in df_people_nps_table.index], colLabels=[''], bbox=[0, 0, 1, 1], rowColours=['#000000']*len(nps_data_table), colColours=['#000000'], edges='horizontal')
h_table.set_fontsize(12)
h_table[(0, 0)].set_edgecolor('#0E1117')

ax2 = subfigs[1][1].subplots()
p_table = ax2.table(cellText = df_people_nps_table.values, colLabels=df_people_nps_table.columns, bbox=[0, 0, 1, 1], cellColours=nps_colors, colColours=['#000000']*len(nps_data_table[0]), edges='horizontal')
p_table.set_fontsize(12)

ax3.axis('off')
ax2.axis('off')
ax1.grid(False)
ax1.set(ylim=(0,df_people_nps_graph['Actual'].max()*1.2),
        xlabel=None, 
        yticklabels=[], 
        yticks=[],
        xticks=[], 
        ylabel=None) # xticklabels(labels=df_people_nps_graph['Labels'] ,rotation=45)
ax1.bar_label(ax1.containers[0])
ax1.margins(x=0.02) # shift a bit horizontally for alignment
ax1.legend(loc='upper center', ncol=len(df_people_nps_graph.columns), fontsize=14, frameon=False, bbox_to_anchor=(0.5, 1.3)) # bbox allows placing legend outside of figure
sns.despine(left=True)
plt.axis('off')
plt.show()

Found it! Would love to understand the logic behind it, but setting the size wasn’t enough. I needed to explicitly turn off auto_set_font_size.

h_table.auto_set_font_size(False)

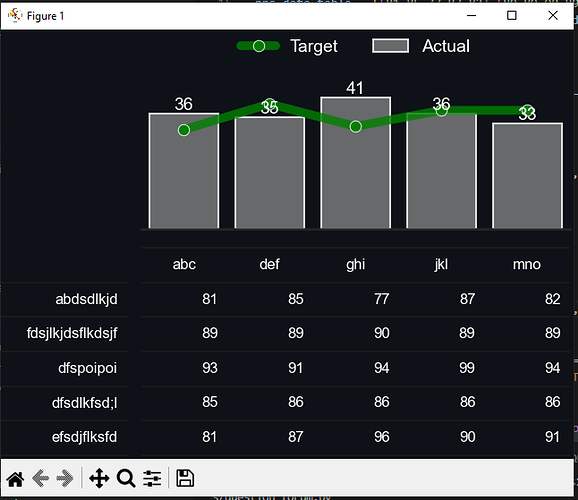
final picture and code, for people that are looking for a solution on the same.

import pandas as pd
import matplotlib
import matplotlib.pyplot as plt
import seaborn as sns

labels = ['abc','def','ghi','jkl','mno']
actual = [36,35,41,36,33]
target = [31,39,32,37,37]

data_dict_people = {'Labels':labels,'Actual':actual,'Target':target}
df_people_nps_graph = pd.DataFrame(data = data_dict_people)

index_labels = ['abdsdlkjd', 'fdsjlkjdsflkdsjf', 'dfspoipoi', 'dfsdlkfsd;l', 'efsdjflksfd']
nps_data_table = [[81,85,77,87,82],[89,89,90,89,89],[93,91,94,99,94],[85,86,86,86,86],[81,87,96,90,91]]
df_people_nps_table = pd.DataFrame(data = nps_data_table, columns=labels, index=index_labels)

nps_colors = []
for i in range(0,len(nps_data_table)):
    nps_colors.append(['#000000']*len(nps_data_table[0]))

matplotlib.rc_file_defaults()
sns.set_theme(style="ticks", 
                context="talk", 
                rc={'axes.facecolor':'#0E1117', 
                'figure.facecolor':'#0E1117', 
                'text.color':'white',
                'font.size':14,
                'axes.labelcolor':'white',
                'xtick.color': 'white'})

fig = plt.figure(constrained_layout = True)
subfigs = fig.subfigures(2,2, height_ratios=[1,1], hspace=0, width_ratios=[3,10])

ax1 = subfigs[0][1].subplots(1,1,sharey=True)
bp = sns.barplot(data = df_people_nps_graph, x='Labels', y='Actual', alpha=0.8, ax=ax1, color='grey', label='Actual') 
lp = sns.lineplot(data = df_people_nps_graph['Target'], marker='o', sort = False, ax=ax1, alpha=0.8, color='green', linewidth=7, label='Target')

ax_row_names = subfigs[1][0].subplots()
h_table = ax_row_names.table(cellText = [[i] for i in df_people_nps_table.index], colLabels=[''], bbox=[0, 0, 1, 1], rowColours=['#000000']*len(nps_data_table), colColours=['#000000'], edges='horizontal')
h_table.auto_set_font_size(False)
h_table.set_fontsize(12)
h_table[(0, 0)].set_edgecolor('#0E1117')

ax2 = subfigs[1][1].subplots()
p_table = ax2.table(cellText = df_people_nps_table.values, colLabels=df_people_nps_table.columns, bbox=[0, 0, 1, 1], cellColours=nps_colors, colColours=['#000000']*len(nps_data_table[0]), edges='horizontal')
p_table.set_fontsize(12)

ax_row_names.axis('off')
ax2.axis('off')
ax1.grid(False)
ax1.set(ylim=(0,df_people_nps_graph['Actual'].max()*1.2),
        xlabel=None, 
        yticklabels=[], 
        yticks=[],
        xticks=[], 
        ylabel=None) # xticklabels(labels=df_people_nps_graph['Labels'] ,rotation=45)
ax1.bar_label(ax1.containers[0])
ax1.margins(x=0.02) # shift a bit horizontally for alignment
ax1.legend(loc='upper center', ncol=len(df_people_nps_graph.columns), fontsize=14, frameon=False, bbox_to_anchor=(0.5, 1.3)) # bbox allows placing legend outside of figure
sns.despine(left=True)
plt.axis('off')
plt.show()