Hi:
Any suggestion for making a stair plot in Matplotlib (like the stairs
function in Matlab)?
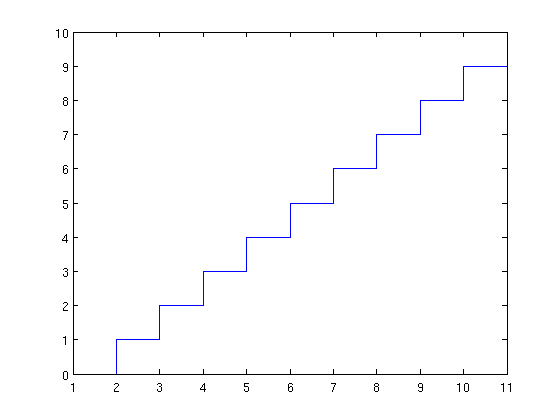
The attached figure is the output of the following Matlab commands:
x = 0:10;
stairs(x);
I guess it is a matter of using a zero-order hold interpolation rather
than linear interpolation between the points in the plot command, but
I haven't find how to do that.
Alejandro.
Alejandro Weinstein, on 2011-02-09 13:01, wrote:
Hi:
Any suggestion for making a stair plot in Matplotlib (like the stairs
function in Matlab)?
The attached figure is the output of the following Matlab commands:
x = 0:10;
stairs(x);
I guess it is a matter of using a zero-order hold interpolation rather
than linear interpolation between the points in the plot command, but
I haven't find how to do that.
Hi Alejandro,
no need for interpolation - just use plt.step:
import numpy as np
import matplotlib.pyplot as plt
x = np.arange(10)
plt.step(x,x)
you might also want to play with step's "where" parameter for
slightly different behavior of where the transition between the
steps occurs.
best,
···
--
Paul Ivanov
314 address only used for lists, off-list direct email at:
http://pirsquared.org | GPG/PGP key id: 0x0F3E28F7
Thanks! Just what I need it.
Any reason for the step function not appearing in the main Matplotlib
page (http://matplotlib.sourceforge.net/)?
Alejandro.
···
On Wed, Feb 9, 2011 at 1:23 PM, Paul Ivanov <[email protected]...> wrote:
no need for interpolation - just use plt.step: